

Cattle counter in drone video: the Docker execution architecture

Translated from the original Portuguese article. Ler o original em português

A few days ago I was asked to build a cattle counter on drone video, and I decided to write a basic tutorial on how to reuse pretrained models and deploy them on Docker, so I can reuse the service later.
In this article I show what I built, a batch service that reads a folder of drone videos, counts the cattle with an already trained detector and a tracker, and writes one JSON per video. I trained nothing. On the two videos I tested, it estimates 36 animals on a pasture, which matches the reference count, and 246 on a moving herd, probably below the real number.
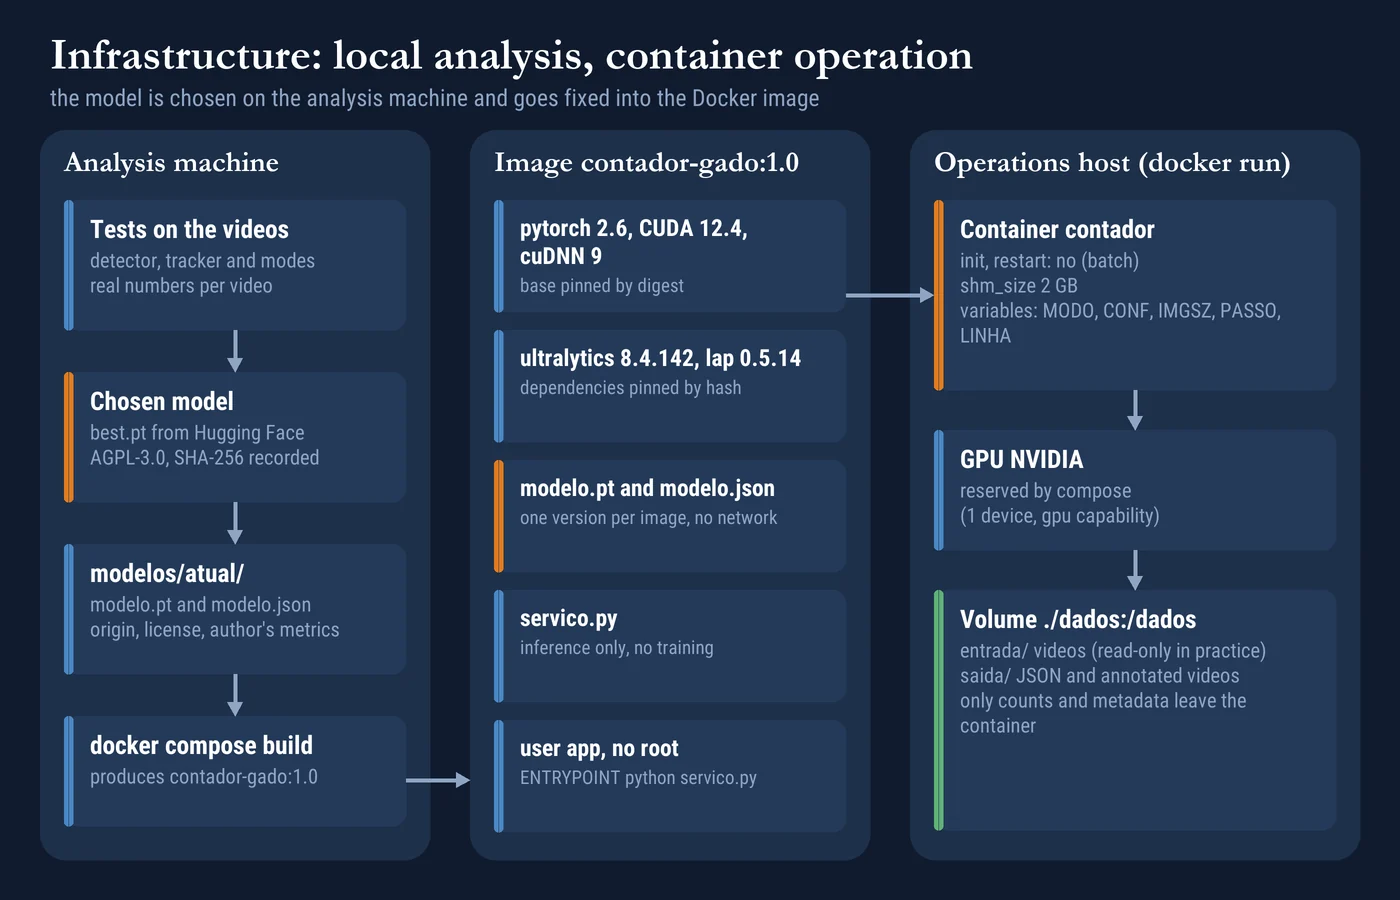
The hard part is what comes after the counting works. Someone will drop a folder of drone videos, expect one number per video and, three months later, ask where that number came from and with which model version. So the focus here is the execution architecture. The analysis and the choice of model happen on my machine, where I test detectors and counting modes on the videos, and what goes into Docker is only the chosen model and the inference code.
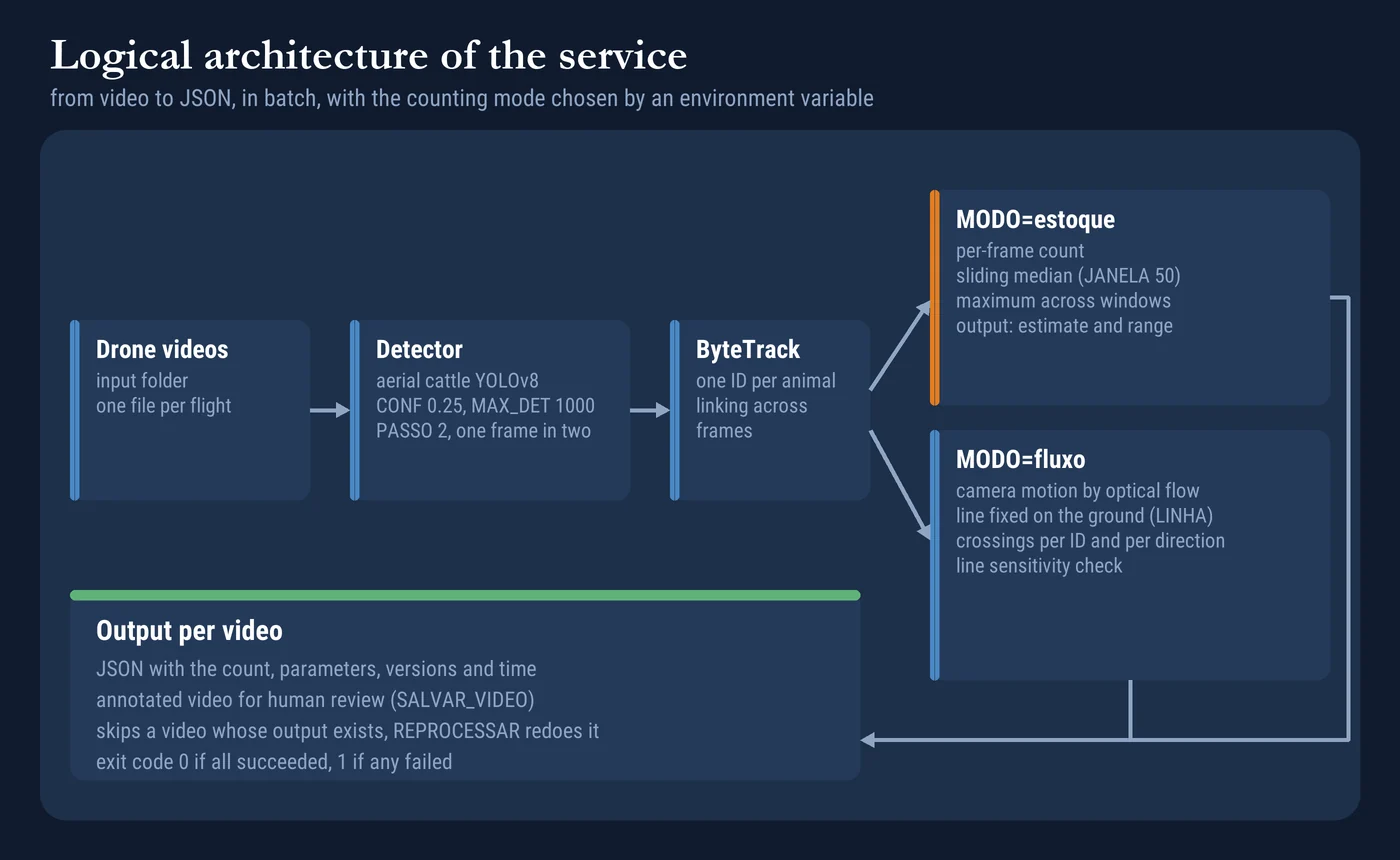
Inside, the path is short. The video comes in, the detector finds the boxes, the tracker gives each animal an ID and the service computes the number and writes the JSON.
I used two drone videos with cattle, one of a pasture (4K, 35 s, video 2766950) and one of a moving herd (Full HD, 60 fps, 15 s, video 12509069), both from Pexels. The idea is to show what you can do with a ready-made model and a tracker, and where the count stops being reliable.
The detector: a cattle model that sees from above
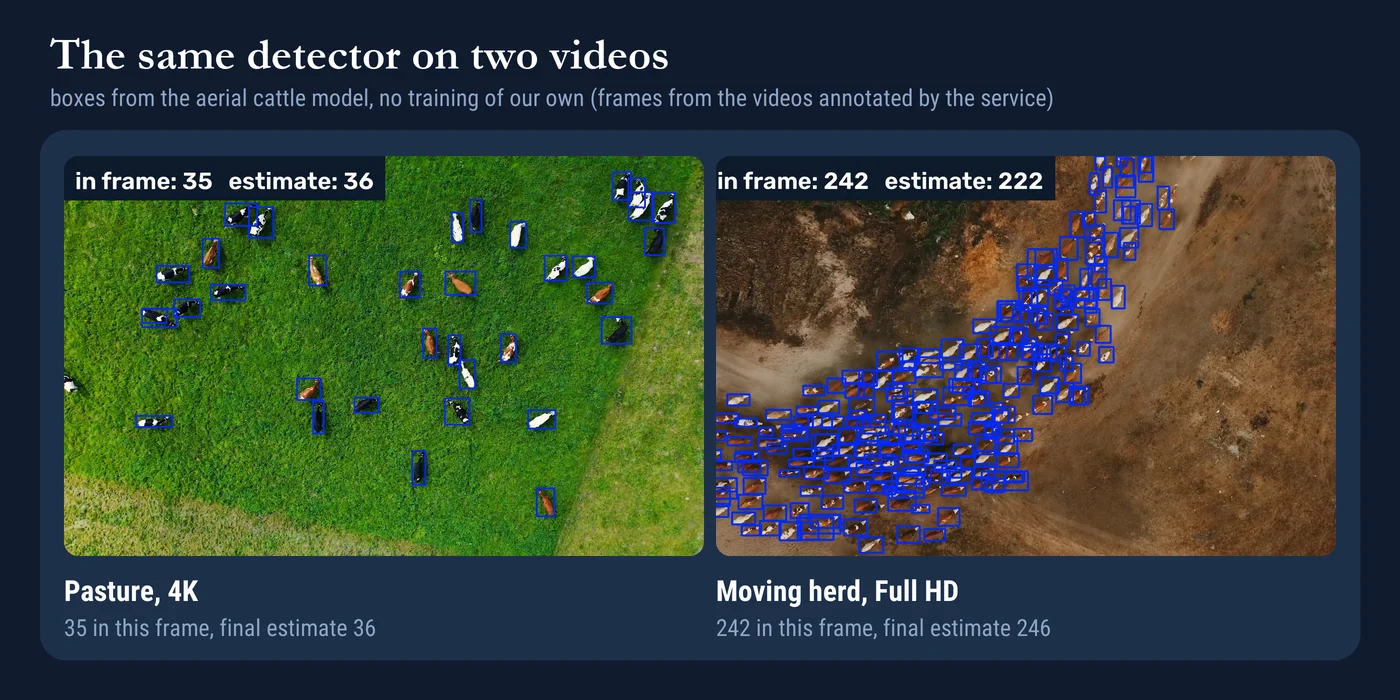
We tend to assume that a model trained on COCO counts cattle anywhere, but it learned to see a cow from the side, standing in the pasture. From above, in a drone video, the animal becomes an elongated blob, and the generic models I tried returned few boxes or none. That means the model was not bad, it was just trained for a different picture. So I went looking for a detector already fine-tuned for cattle in aerial imagery and found cattle-detection-yolov8, by nsagatov1, a YOLOv8 published on Hugging Face (AGPL-3.0 license, which I explain further on). I downloaded best.pt and recorded its SHA-256 in modelo.json, so I can tell later which file produced each number.
The metrics that come with the model belong to the author and were measured on data that is not mine, so I only claim what I saw in the two videos. In practice, I look at the median of the per-frame count, which is the middle value once you sort the count of all frames. On the pasture it gives 35 cows, and the reference count also gave 35 on the six frames I checked. On the herd the median is 209, and the count no longer closes so well, as I show in the validation section.
Why counting unique IDs does not work
The obvious path is to track each animal, give it an ID and count IDs. I used ByteTrack, which in my test was four times faster than BoT-SORT at 4K with similar counts (both are trackers, which link boxes across consecutive frames to give each animal an ID).
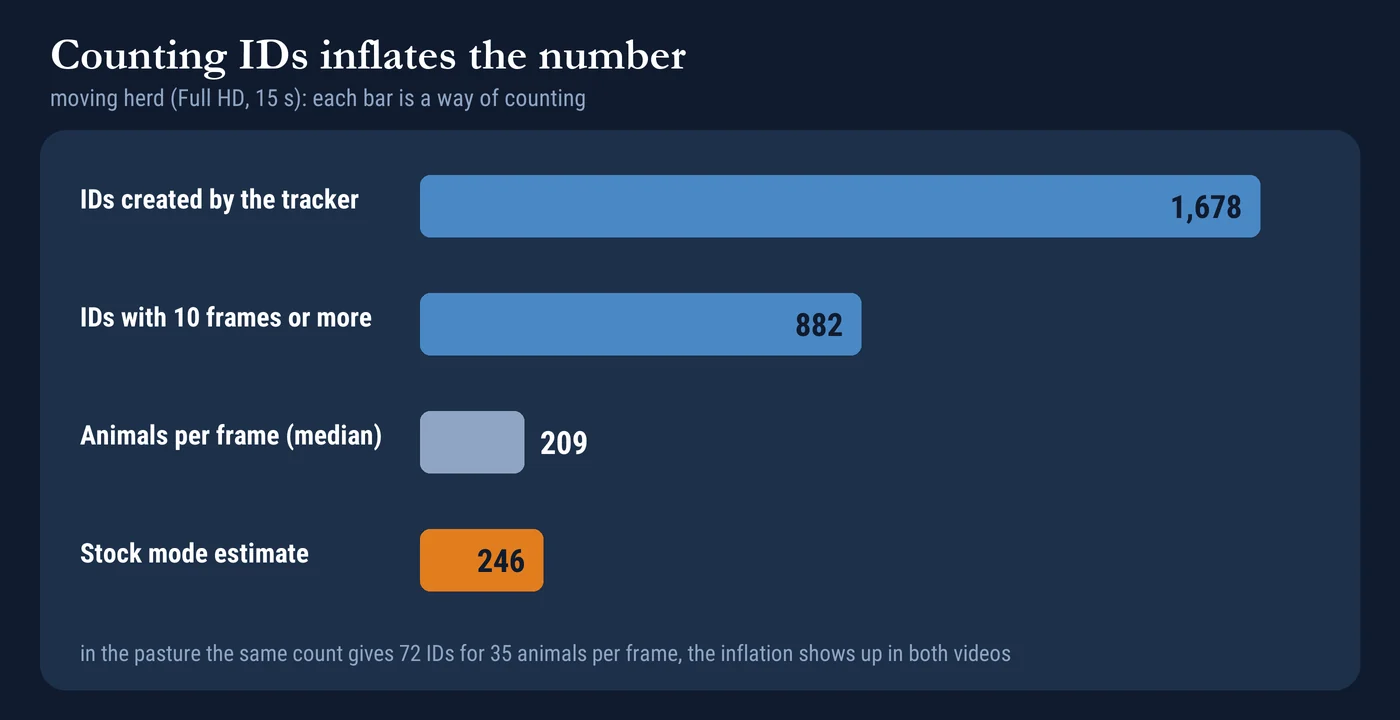
The problem is that the tracker loses and finds the same animal again, and each rediscovery can become a new ID.
| Video | IDs created | IDs with 10+ frames | Animals per frame (median) |
|---|---|---|---|
| Pasture (4K) | 72 | 46 | 35 |
| Herd (Full HD) | 1,678 | 882 | 209 |
In the herd, counting IDs would give about eight times the median per frame (1,678 against 209). Even keeping only the IDs that last 10 frames or more, which discards the short-lived ones, there are 882, still about four times the median per frame. That changes what the architecture has to do. The final number cannot come from the tracker. It comes from the per-frame count (the number of boxes detected in each frame), and the tracker stops being the center of the service.
Two counting modes, because they are two problems
For a herd that is still or almost still, what I want is a stock, how many animals exist. For cattle on the move, what I want is a flow, how many passed a point. The service has both, chosen by MODO (estoque for stock and fluxo for flow).
In stock mode, the idea is to find the moment when the whole herd is in view, because it enters and leaves the scene during the video. I slide a window of 50 processed frames across the video. Since PASSO is 2, the service processes one frame out of every two, so the window covers 100 frames of the video. At each position I take the median of the animal count, and the estimate is the highest of those medians, the stretch where the herd is most fully in view.
The median keeps a single frame, with a duplicated box or an animal cut off at the edge, from deciding the number. That is why the herd estimate of 246 is larger than the median of 209 for the whole video, since 209 includes the moments when the herd had not yet arrived or had already left.
def mediana_movel_maxima(serie, janela):
    """Maior mediana de `janela` quadros seguidos (ou a mediana da série toda, se ela for mais curta)."""
    if len(serie) <= janela:
        return statistics.median(serie) if serie else 0
    return max(statistics.median(serie[a:a + janela]) for a in range(len(serie) - janela + 1))
The JSON also stores the maximum of a single frame. The range goes from the estimate up to that maximum, which acts as an upper bound. It is not a confidence interval, just the distance between the estimate and the peak of a single frame. And since the estimate is the maximum of several medians, it tends to sit above the typical value by construction.
pasto     estimativa 36   faixa [36, 39]   (manual: 35)
rebanho   estimativa 246  faixa [246, 265]
In the pasture the number matches the reference count. In the herd the reference is higher (see the validation section), so the range, from 246 to 265, should be read with that caveat.
To see how much the choice of estimator matters, I compared four of them on the per-frame count, which the JSON now stores.
| Estimator | Pasture | Herd |
|---|---|---|
| Median of the whole video | 35 | 209 |
| 90th percentile of the per-frame count | 36 | 241 |
| Highest window median (the service's estimate) | 36 | 246 |
| Highest single frame | 39 | 265 |
In the pasture all four fall between 35 and 39. In the herd, the median of the whole video (209) sits well below, and the 90th percentile (241) is only 2% below the estimate (246). The upward bias of the maximum of the medians exists by construction, but it is small on these videos.
Flow mode and the moving camera
Counting what crosses a line looks simple, until the camera moves. On a drone that follows the cattle, a line drawn on the image moves along with the camera and does not mark any point on the ground. So flow mode estimates how far the camera moved between one frame and the next, by measuring how the background of the image shifts, and corrects the position of each animal as if the camera were still. The line then stays fixed on the ground.
An ID crosses the line when it goes from one side to the other between two frames, and it counts once per direction. Only the crossing counts, so losing and re-finding an animal does less harm here than in the ID count.
The line also needs an orientation. A vertical line on the image misses a herd walking diagonally, and the count would depend on an angle nobody chose.
With LINHA=auto, the service measures where the animals are walking over the first 60 processed frames and places the line across that direction, at the center of the herd. The positive direction is the direction of movement, and after that the line does not change. When you know where the cattle pass, LINHA also accepts two points.
In the herd video, the camera follows and climbs. To find out whether the flow number is firm, the JSON repeats the count with the line shifted along the movement (the offset, in pixels, where 0 is the automatic line), and the table shows the result. At the calculated position (offset 0), 90 animals crossed in the direction of movement and 10 in the opposite one.
| Line offset (px) | Positive direction | Negative direction |
|---|---|---|
| -200 | 117 | 21 |
| -100 | 102 | 10 |
| 0 | 90 | 10 |
| +100 | 85 | 3 |
| +200 | 78 | 6 |
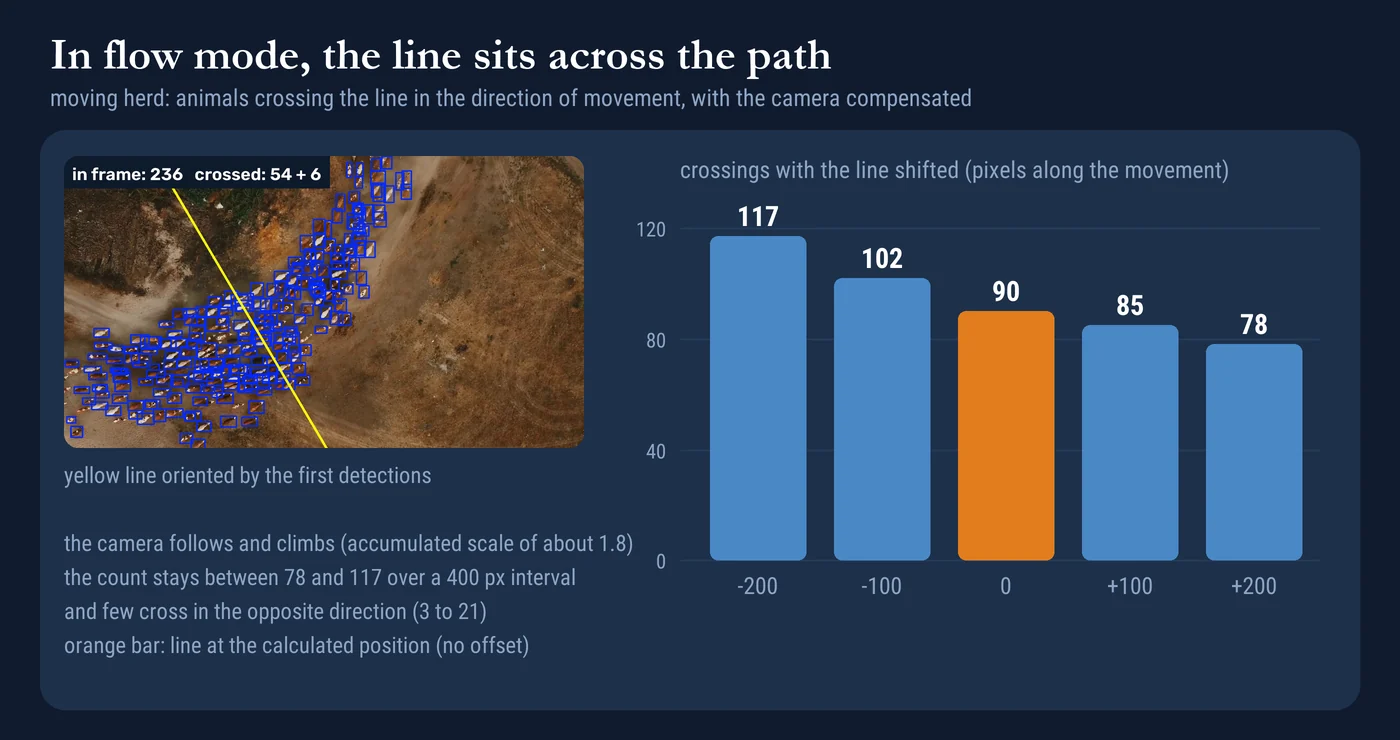
Shifting the line, the count varies from 78 to 117, and the variation shows how much the number depends on where the line falls.
The few animals that cross in the opposite direction look like noise, IDs that oscillate around the line.
There is also a limitation of the video itself, because in 15 s the herd does not cross the line entirely. The flow tells how many passed during the video (90 at the calculated line, and 78 to 117 depending on the line position). The stock tells how many were in view (246). They are different questions. The flow JSON carries the counts at the shifted line positions next to the main number, because a result without them would look firmer than it is.
In the pasture video, where the cattle graze almost without moving, the same mode counts 2 to 4 animals crossing the line, depending on the position. That is expected, because nobody crosses anything, and it shows that flow is not a worse version of stock. It is a different measurement.
In practice, the choice depends on what the drone did. For a still or slow flight over a herd that stays in one place, stock. For a pass where the cattle really cross a point (a corridor, a gate, a corral), flow. If neither fits, the service does not choose for you. It uses the configured MODO and records in the JSON the mode that was used.
How close the number is to the reference count
To find out whether the number is close to reality, I built a reference count on 9 frames of the original videos, 6 from the pasture and 3 from the herd, at the same moments for which the service has the per-frame count. The images are the raw frames, without the detector's boxes. Each frame was counted independently, blind to the detector's result, three times on the pasture and twice on the herd. The counts were made with AI support and I validated the result. On the herd, which is dense, I split each frame into nine blocks and counted block by block.
On the pasture, the three counts agree on 35 animals in all six frames. The detector counted 35, 35, 35, 33, 34 and 35, an error of at most two animals, always on the low side.
| Herd frame | Count A | Count B | Reference (average) | Detector | Detector vs reference |
|---|---|---|---|---|---|
| 1 | 211 | 238 | 224.5 | 193 | -14% |
| 2 | 277 | 280 | 278.5 | 242 | -13% |
| 3 | 277 | 260 | 268.5 | 209 | -22% |
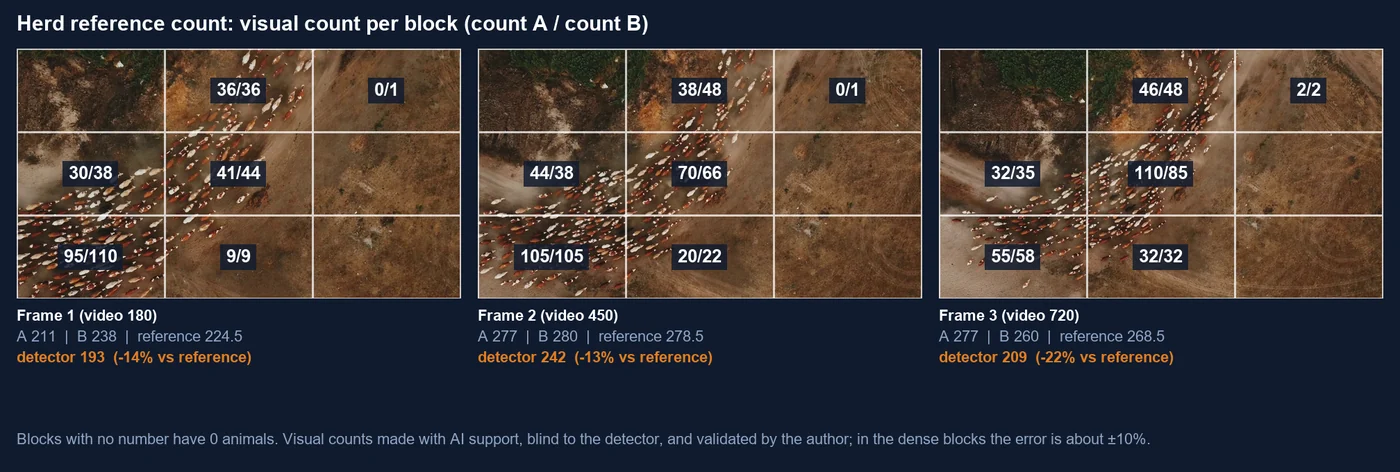
On the herd, the detector counts 13% to 22% fewer than the reference. The reference has its own error, because in the densest blocks the animals overlap (the two counts differ by 1% to 12%, and the error in those blocks is about 10%), but the gap is larger than that uncertainty in all three frames. So the estimate of 246 should be read as probably low for this herd. On the fullest frame, the reference sits between 277 and 280, against the 242 the detector counted.
These are nine frames from two videos, so this shows the direction of the error and does not allow estimating a correction factor. On a dense herd, it is worth calibrating the service with a sample of your own.
The Docker image: fixed model, minimal code
Here is the architecture decision that weighs the most. The model goes into the image at build time. Each image carries exactly one version of the model, and the service runs without a network, with Ultralytics online checks turned off (YOLO_OFFLINE=1) and its telemetry disabled at startup.
# a base é fixada pelo digest, então uma reconstrução futura parte da mesma imagem
FROM pytorch/pytorch:2.6.0-cuda12.4-cudnn9-runtime@sha256:77f17f843507062875ce8be2a6f76aa6aa3df7f9ef1e31d9d7432f4b0f563dee

# o serviço não usa rede: sem verificações online do Ultralytics e com a pasta de configuração onde o usuário pode escrever
ENV PYTHONUNBUFFERED=1 \
    PIP_NO_CACHE_DIR=1 \
    YOLO_OFFLINE=1 \
    YOLO_CONFIG_DIR=/tmp

# bibliotecas de sistema que o OpenCV (dependência do Ultralytics) precisa
RUN apt-get update \
    && apt-get install -y --no-install-recommends libgl1 libglib2.0-0 \
    && rm -rf /var/lib/apt/lists/*

WORKDIR /app
COPY requirements-servico.txt .
# lock com hashes: o pip só instala o que bate com o hash e não resolve mais nada sozinho
RUN pip install --require-hashes --no-deps -r requirements-servico.txt

# o modelo escolhido entra na imagem, então o serviço roda sem rede e cada imagem carrega uma versão fixa
COPY modelos/atual/modelo.pt /app/modelo.pt
COPY modelos/atual/modelo.json /app/modelo.json
COPY servico.py ./

RUN useradd --create-home app && chown -R app /app
USER app

ENTRYPOINT ["python", "servico.py"]
The modelo.json next to the .pt records the origin, the license, the SHA-256 of the file and the metrics declared by the author, with a note that the model was used as it came.
The code runs as a regular user. The base is pinned by digest, and the 22 dependencies that pip installs on top of it (among them ultralytics, lap and OpenCV) are locked with hashes, so a rebuild starts from the same point. What stays unpinned are the system packages that apt installs (libgl1 and libglib2.0-0).
The rest of the configuration comes from environment variables, and docker-compose.yml reserves the GPU and mounts a data folder.
services:
  contador:
    build: .
    image: contador-gado:1.0
    init: true
    shm_size: "2gb"
    environment:
      ENTRADA: /dados/entrada
      SAIDA: /dados/saida
      MODO: estoque
      CONF: "0.25"
      IMGSZ: "1920"
      MAX_DET: "1000"
      RASTREADOR: bytetrack.yaml
      PASSO: "2"
      JANELA: "50"
      SALVAR_VIDEO: "1"
    volumes:
      - ./dados:/dados
    deploy:
      resources:
        reservations:
          devices:
            - driver: nvidia
              count: 1
              capabilities: [gpu]
    restart: "no"
A few details look trivial but matter in operation. The restart: "no" is there because this is a batch service, which ends when the videos run out. MAX_DET=1000 is there because Ultralytics limits detections to 300 per frame by default, and a dense herd hits that ceiling without warning. PASSO=2 processes one frame out of every two to reduce the time, and the scaling section shows the effect on the count.
Output contract: one JSON per video
For each video, the service writes <video>_<mode>.json and, if SALVAR_VIDEO=1, an annotated video (the original video with the boxes and the counter drawn on it) for human review. The JSON carries the result, the count of each frame, the parameters used, the library versions (including NumPy and OpenCV), the SHA-256 of the model, the device and the time spent. The SHA-256 is computed at startup and checked against modelo.json. I changed one character of that hash as a test, and the service refused the model and exited with code 1. If the output file already exists, the video is skipped (REPROCESSAR=1 forces a redo), so running the batch twice does not duplicate work. The exit code is 0 when all videos succeeded and 1 when any failed, and that is what a scheduler or a CI pipeline reads.
Only numbers and metadata leave the container. The raw video stays in the input folder.
Running on Docker
The build produces the contador-gado:1.0 image. Then come two runs, one per mode, over the same folder with the two videos.
docker compose build
docker compose run --rm contador
docker compose run --rm -e MODO=fluxo contador
The service writes one JSON event per line. These are the ones from stock mode, with "dispositivo": "0" confirming that the container saw the GPU.
{"evento": "inicio", "videos": 2, "modo": "estoque", "dispositivo": "0", "ultralytics": "8.4.142"}
{"evento": "concluido", "video": "12509069_1920_1080_60fps.mp4", "segundos": 67.8, "modo": "estoque", "ids_criados": 1678, "ids_com_duracao_minima": 882, "maximo_num_quadro": 265, "mediana_por_quadro": 209.0, "estimativa_animais": 246.0, "faixa": [246.0, 265]}
{"evento": "concluido", "video": "2766950-uhd_3840_2160_30fps.mp4", "segundos": 133.0, "modo": "estoque", "ids_criados": 72, "ids_com_duracao_minima": 46, "maximo_num_quadro": 39, "mediana_por_quadro": 35, "estimativa_animais": 36.0, "faixa": [36.0, 39]}
{"evento": "fim", "falhas": 0}
All four runs exited with code 0. The times in the table below include loading the model, detecting and tracking, and each one comes from a single run, with no repetition. The "without annotated video" column comes from a repeat of stock mode with SALVAR_VIDEO=0, and the counts came out identical (246 and 36).
I also ran the herd flow, with annotated video, using docker run --network none (no network at all). The result was the same, 90 and 10.
| Video | Stock, without annotated video | Stock, with annotated video | Flow, with annotated video |
|---|---|---|---|
| Herd, Full HD, 15 s | 39 s | 68 s | 92 s |
| Pasture, 4K, 35 s | 30 s | 133 s | 155 s |
License: what you can do with this
A ready-made tool almost always comes with a condition. The model I used is AGPL-3.0, according to its page on Hugging Face, and the Ultralytics library that loads the model is also AGPL-3.0, with a paid commercial license as an alternative, described on the Ultralytics licensing page.
Running the service in-house, in batch, on your own videos, and using only the numbers, is the easiest case. The problem appears when you distribute the Docker image or offer the counter as a service over the network, because the AGPL requires that whoever uses the service can receive its source code. If the counter is going to become a product, the exits are to buy the commercial license or to swap the detector for one with a permissive license, trained on your own data.
A note on the videos. The Pexels test videos are for demonstration only, because in operation the videos are yours, with the permission of whoever filmed them.
How to scale
I measured GPU use and the run times in the container. The split into replicas (other copies of the container), further on, is a proposal and was not tested. During the runs, the GPU sat between 7% and 30% and the container used a little more than one core, on a machine with 20 threads. Neither was saturated. The service processes one frame at a time, in series, so the GPU idles while the CPU decodes and tracks.
In the herd profile (with Python's cProfile, inside the container), the neural network, the only part that uses the card, took less than 20% of the time, and the ByteTrack tracker took close to 40%. That is why the GPU sits idle.
From the table in the previous section, writing the annotated video adds 29 s on Full HD, more than 40% of the time, and 103 s on 4K, three quarters of the time. The rule is simple. Default to SALVAR_VIDEO=0 and save the annotated video only for review by sampling. It is also worth measuring with the machine idle, because my first measurements, taken with other tasks running, gave times about three times larger.
To go faster on one machine, the other knobs are PASSO and IMGSZ (smaller input, which I did not measure), and both trade accuracy for time. I measured PASSO in stock mode, without annotated video, keeping the window at about 100 frames of the video (JANELA 100, 50 and 33).
PASSO |
Pasture, estimate | Pasture, time | Herd, estimate | Herd, time |
|---|---|---|---|---|
| 1 | 36 | 55 s | 251.5 | 71 s |
| 2 | 36 | 30 s | 246 | 39 s |
| 3 | 36 | 24 s | 241 | 28 s |
Processing every frame takes almost twice as long as PASSO=2, and the herd estimate rises from 246 to 251.5, about 2%. With PASSO=3 it drops to 241. The pasture does not change. On these two videos the effect is small, but each point is a single run.
To go beyond one machine, the service already helps in two ways. The image has everything inside, including the model, and needs no network, so it goes anywhere with a GPU. And existing output is skipped, so an interrupted batch resumes where it stopped.
What is missing is splitting the work. Today the service lists the whole folder, so two replicas pointed at the same folder would pick up the same videos. To scale for real, each replica needs to receive a subset, by folder or through a queue of videos, with the videos and the JSONs on shared storage. From there, what I would watch is the time per video in the JSON, the exit code of each run and the JSON log, which already come ready.
When to use it and when not to
This design suits batch operation with a fixed model, where what matters is knowing which version produced which number. It does not replace a validation with manual counts on videos of your own herd, and I did that on nine frames of two videos. Before treating the number as official, it is worth having a sample of videos counted by hand, to state the typical error of each mode.
The part that lasts is the execution contract, the model tied to the image, the declared mode, the range instead of a loose number and the JSON that explains how the number was obtained. What that contract does not guarantee is that the number is right. On the nine frames I checked, it is right on the pasture and undercounts the dense herd, and it still needs validation on more videos.
The code is in the blog's GitHub repository. The model is not included, and the README explains where to download it.
References
JOCHER, Glenn; QIU, Jing; CHAURASIA, Ayush. Ultralytics YOLO. Version 8.0.0. Ultralytics, 2023. Software, AGPL-3.0 license. github.com/ultralytics/ultralytics
NSAGATOV1. cattle-detection-yolov8. Hugging Face, 2026. Model, AGPL-3.0 license. huggingface.co/nsagatov1/cattle-detection-yolov8
ZHANG, Yifu; SUN, Peize; JIANG, Yi; YU, Dongdong; WENG, Fucheng; YUAN, Zehuan; LUO, Ping; LIU, Wenyu; WANG, Xinggang. ByteTrack: multi-object tracking by associating every detection box. In: Computer Vision, ECCV 2022. Lecture Notes in Computer Science. Cham: Springer Nature Switzerland, 2022. p. 1-21. DOI: 10.1007/978-3-031-20047-2_1


