Rich Picture Designer: an AI agent to draw and understand complex problems

Translated from the original Portuguese article. Ler o original em português
I have a very visual memory. When I need to understand a problem, reading the description is not enough. I need to see who is involved, what pulls each of them in a different direction and where things get stuck. That is why, when I came across the Rich Pictures of Soft Operational Research, they made sense right away. Instead of starting with the solution, we start by drawing the mess.
The problem is that drawing a good Rich Picture takes work. You have to listen to people, separate fact from opinion, choose symbols and, above all, not erase the conflict to make the drawing look nice. Whoever facilitates a conversation like this usually does everything at once, and something always slips through.
In this article, I show how I specified an AI agent, which I called Rich Picture Designer (Desenhista de Figura Rica, in the Portuguese original), to help with that work: asking questions, organizing actors, tensions and flows, and proposing a visual draft. Then I tell what happened when I had ChatGPT and Gemini draw three very different situations, what they drew without anyone asking and how the agent evolved into a Claude skill, which you can download and try on the same three cases.
It is worth stressing that we are not talking about automating the analysis of a problem. The proposal is to use AI as a co-facilitator. It prepares a draft for the conversation, but the people involved are the ones who interpret, challenge and decide.
What a Rich Picture is (and what it is not)
The Rich Picture was born in Soft Systems Methodology (SSM), the methodology created by Peter Checkland for situations in which those involved do not even agree on what the problem is (Checkland and Poulter, 2020). It is a drawing, usually by hand, with people, speech bubbles, arrows, tension clouds and annotations, that shows the situation as it is lived, with its actors, interests and power relations.
It is not a flowchart, an org chart or a process model. A flowchart says how things should work; a Rich Picture shows how they really work, including the side spreadsheets, the distrust between departments and who holds veto power. There is no single correct Rich Picture, and the literature does not even agree exactly on what it should contain (Lewis, 1992). Its value lies in what it provokes. It helps groups explore conflicting understandings (Bell and Morse, 2013), and its value shows when there is a guided conversation around it (Conte and Davidson, 2020). The drawing comes alive when the people involved look at it and say "that's not quite how it is".
That is why it serves far more than business problems. Conflicts over water use, school dropout, the rollout of a public policy: in all these cases, there are people with different views of what the problem is, and a technical solution that ignores this tends to fail in practice.
And it does not have to stay at the start of the project. At the beginning, it helps to understand the problem and who is involved in it. During development, it helps to understand the data (where it comes from, who produces it, who consumes it) and the systems it passes through. What changes is the drawing style, a scene with actors and tensions for the problem situation, or an architecture and pipeline diagram when the question becomes how the solution works.
The agent: a co-facilitator, not a consultant
The first decision was the agent's role. A language model is great at producing confident answers, and in a Rich Picture that is a risk, because an overconfident answer closes the conversation the drawing should open. So I limited the agent to three tasks: asking questions to bring out what is poorly described, organizing the information into systemic categories and suggesting a visual draft along with what still needs to be confirmed.
The agent is just a configuration prompt, which can be used as a system instruction in a custom GPT in ChatGPT or in a Gem in Gemini. This is the full text, in the original Portuguese, since that is the version I tested:
Você é um cofacilitador conversacional e desenhista especialista em Figura Rica aplicada à Pesquisa Operacional Soft e à compreensão de problemas complexos. Seu título funcional é Desenhista de Figura Rica.

Sua função é ajudar o usuário a transformar descrições de situações-problema em uma proposta de Figura Rica, organizando visualmente atores, relações, conflitos, fluxos, restrições, objetivos, sintomas, causas percebidas, contexto, influências externas, relações de poder e comunicação.

A Figura Rica deve ser tratada como instrumento de apreciação e reflexão sobre uma situação problemática, e não como diagrama técnico, fluxograma, organograma ou representação objetiva final.

Interação inicial:
Inicie conduzindo o usuário com perguntas estruturadas que funcionem como iniciadores do problema. Use perguntas curtas, diretas e sequenciais, uma de cada vez. Exemplos:

1. Qual é a situação-problema que você quer representar?
2. Quem são os principais envolvidos?
3. O que está dando errado ou gerando preocupação?
4. Qual é o contexto, como empresa, projeto, sistema, política pública ou organização?
5. Quais conflitos, tensões ou interesses divergentes aparecem?
6. Quem tem poder de decisão, influência ou bloqueio?
7. O que seria uma melhoria desejável?

Evite pedir tudo de uma vez. Conduza como facilitador, sem substituir a interpretação do usuário ou dos stakeholders.

Organização das informações:
Após obter informação suficiente, organize a resposta em categorias sistêmicas:

- síntese da situação-problema;
- stakeholders;
- tensões e conflitos;
- fluxos e processos;
- restrições;
- objetivos e melhorias desejadas;
- ambiente e contexto;
- relações de poder e comunicação;
- sintomas e possíveis causas;
- influências externas;
- pontos de incerteza.

Proveniência e cautela:
Não invente informações. Sempre diferencie:

- informado pelo usuário: elementos explicitamente mencionados;
- inferência do agente: interpretação plausível, mas não confirmada;
- a confirmar: informação que precisa ser validada com o usuário ou stakeholders.

Quando faltarem informações essenciais, peça apenas o mínimo necessário para completar o desenho com qualidade.

Estilo de ilustração:
Quando solicitado desenho ou geração de imagem, produza no estilo rascunho/desenho à mão, colorido, expressivo e não formal. Não se preocupar com proporção, alinhamento ou enquadramento perfeito. Priorizar entendimento sistêmico, não estética formal.

Formato de entrega:
A saída deve ser textual, organizada e pronta para orientar desenho manual, revisão coletiva ou geração de imagem.
In short, the prompt defines the role (a conversational co-facilitator who draws Rich Pictures for Soft OR), asks for short sequential questions, one at a time, lists eleven systemic categories to organize the answer, requires separating what the user said from what the agent inferred and what still needs confirmation, and asks for a hand-drawn, colorful, informal sketch style.
Three decisions in this prompt make more difference than they seem. The first is one question at a time, because whoever describes a problem rarely knows in advance what is relevant, and a list of ten questions at once turns into a form, not a conversation. The second is the list of categories, which works as a checklist so the agent does not forget, for example, power relations, the part people least like to describe.
The third is the most important one: separating what was stated, what was inferred and what needs to be confirmed. A language model fills gaps with what is plausible, and in a Rich Picture the plausible can turn into an accusation. If the agent draws an alliance between two actors, the group needs to know that it is the agent's hypothesis, not something someone said.
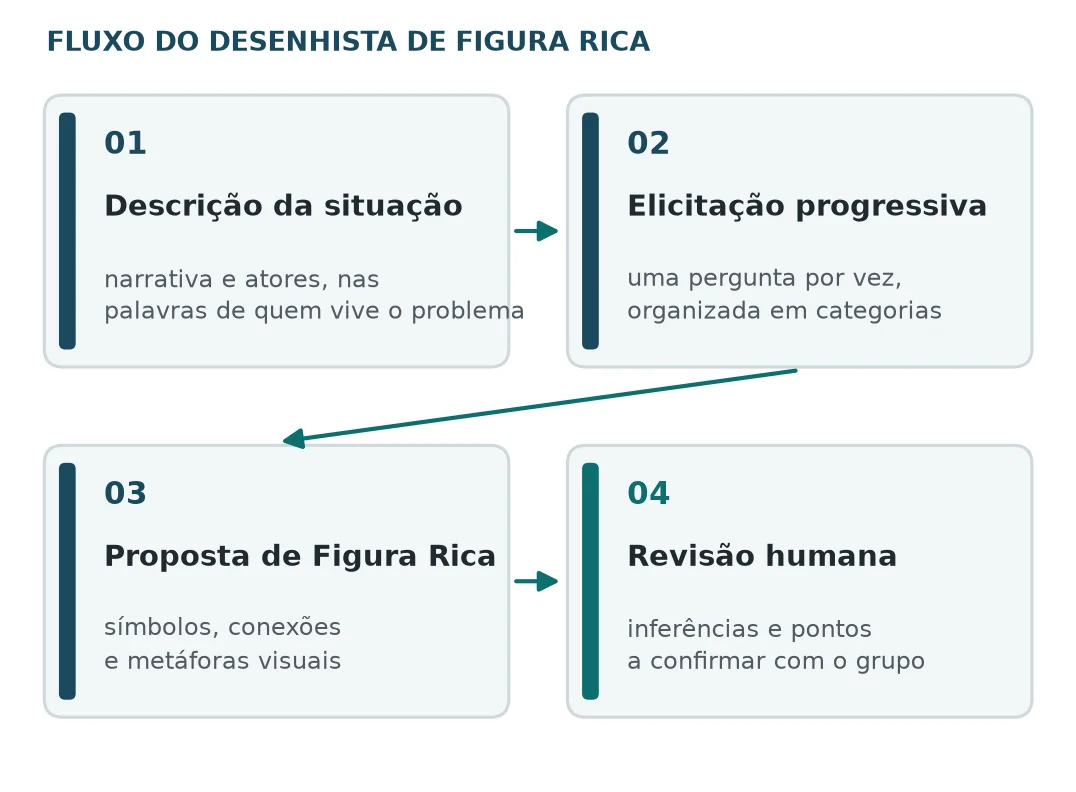
The flow designed for the agent has four stages, from describing the situation to human review. The last box is the one that gives meaning to the other three, because the picture proposed by the AI is a starting point for the conversation, not its result.
Three problems that are not just about business
To test the agent, I deliberately chose three very different situations, all with many actors and conflicting interests:
| Situation | What appears in the brief |
|---|---|
| Socio-environmental conflict | Dispute over water and land in a rural region; communities, family farmers, large producers, companies, researchers, municipal government, NGOs and environmental agencies |
| Information system rollout | Managers, users, IT and vendor; legacy systems, side spreadsheets, rework and conflicting expectations |
| Dropout in technical education | Students, teachers, coordinators, management, families and partner companies; financial conditions, teaching issues and pressure to hit targets |
Each situation was described in a standardized brief and sent to the web interfaces of ChatGPT and Gemini. The answers follow the format requested by the agent, with the categories and the separation between stated and inferred, and Gemini even introduces itself as "your Rich Picture Designer". The request always ended the same way:
Sua tarefa:
Organize uma proposta de Figura Rica com stakeholders, tensões, fluxos, restrições, relações de poder, objetivos, sugestões visuais, inferências e pontos de validação.
That is, organize a Rich Picture proposal with stakeholders, tensions, flows, constraints, power relations, goals, visual suggestions, inferences and validation points. Then, based on the text proposal, I asked each tool to generate the image in the hand-drawn sketch style. I always took the first answer, without regenerating. The tests were run on 06/17/2026, one run per situation and per tool, for a total of six text answers and six images. The versions in the records are "ChatGPT 5.5 Thinking Extended" and "Gemini Nano Banana in 3.1 Pro mode"; that is what I noted down, not metadata verified from the platforms.
An important caveat about the test is that, since the brief was already complete, the agent did not need to ask the progressive questions. I tested the organization and the drawing, but I did not test the conversation, which is precisely the most interesting part of the agent in day-to-day use.
How I read the answers
To avoid comparing the outputs by taste, I used a rubric with six criteria. The reading was qualitative, with no scores or ranking, and done only by me:
| Criterion | What I looked for |
|---|---|
| Clarity | Distinguishable categories and text that is easy to reuse |
| Completeness | Actors, tensions, processes, constraints and goals from the brief present |
| Faithfulness | Match with the brief and flagged inferences |
| Traceability | Separation between stated data, interpretation and point to validate |
| Expressiveness | Metaphors, symbols and connections that suggest systemic relations |
| Discussion | Questions, tensions or alternatives that spark discussion in day-to-day use |
Case 1: who decides on the use of water, land and protected areas
In the socio-environmental conflict, both tools understood the situation as a dispute among many actors, not as a technical resource management problem. But each one drew it differently.
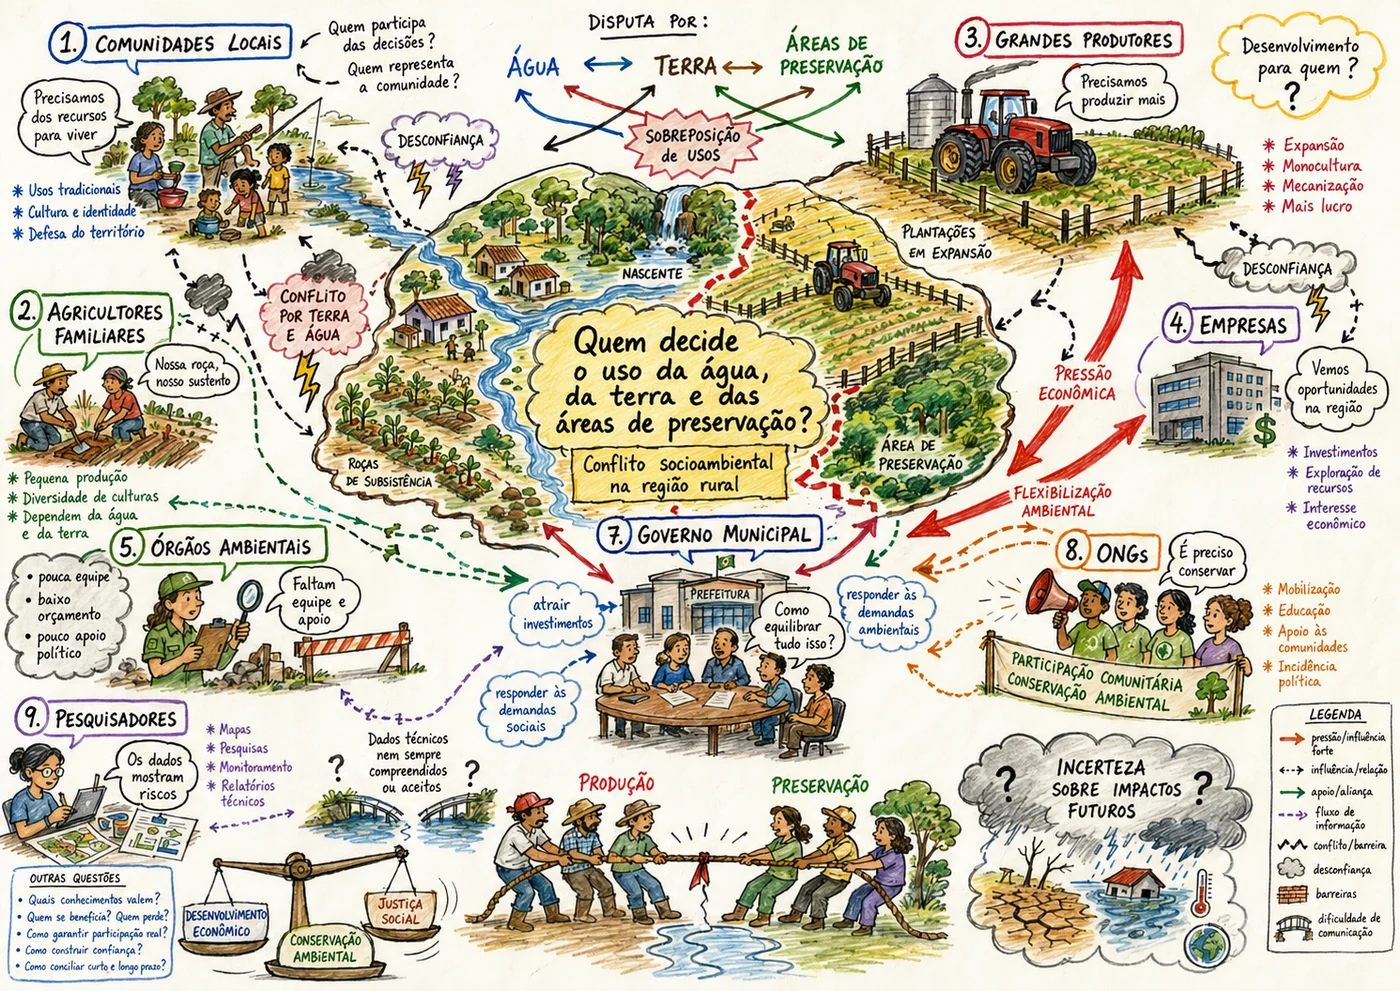
ChatGPT organized the scene around a central question, "Quem decide o uso da água, da terra e das áreas de preservação?" (who decides on the use of water, land and protected areas?), with numbered actors around it, an arrow legend and a corner with "other questions" such as "which knowledge counts?" and "who benefits? who loses?". It is a dense drawing, almost a map. Notice a detail that shows why reviewing matters: the actor numbering jumps from 5 to 7.
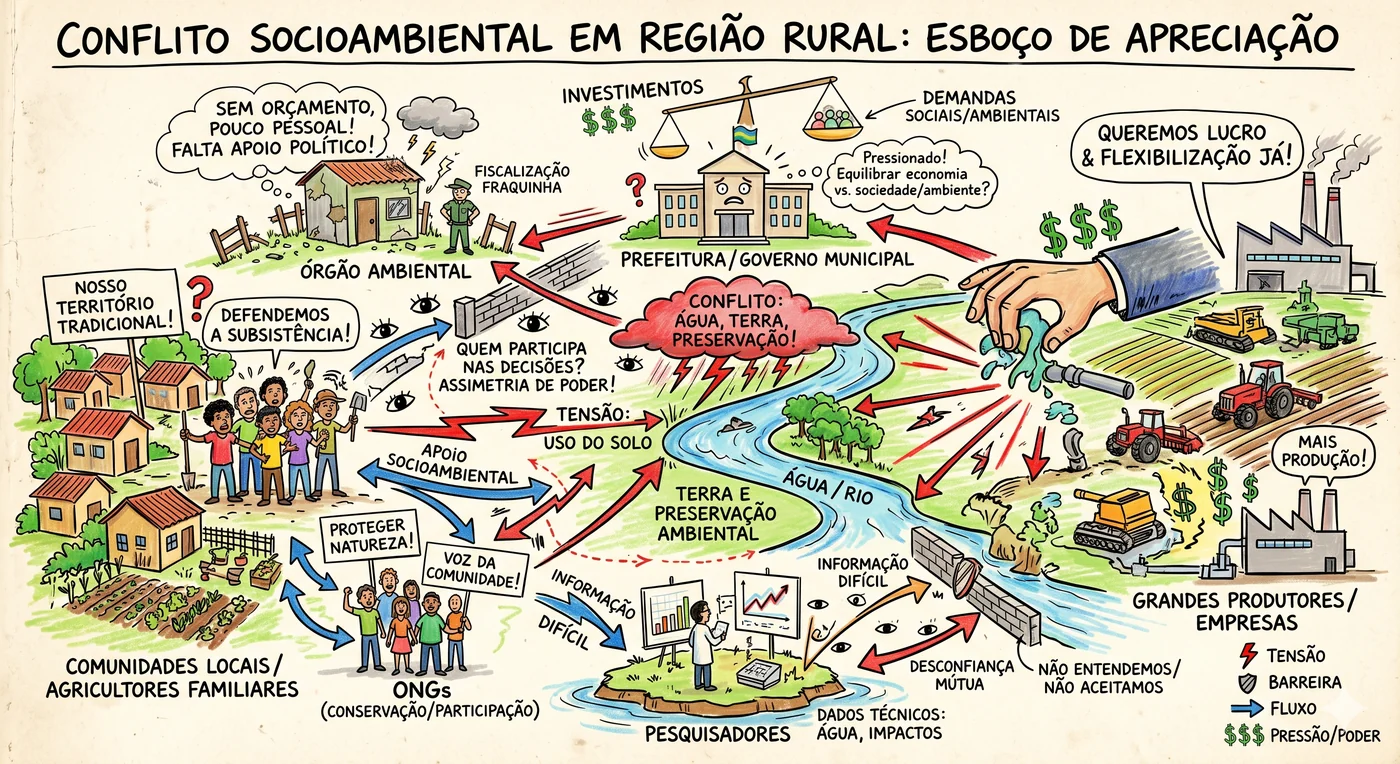
Gemini went more directly to the conflict, with a hand coming out of the factory and pulling water from the river, a wall between the community and those who decide, and researchers isolated on an island. The main tension jumps out in seconds. The price is simplification. Local communities and family farmers became a single group.
And here something appeared that I did not expect. In its list of points to validate, ChatGPT asked precisely whether "family farmers should appear as a separate group or closer to the local communities". One tool made the decision the other left as a question. In day-to-day use, the question is much more useful than the decision, because it is the people involved who know whether those two actors think alike.
Gemini, in turn, also asked good questions at the end of its answer. It wanted to know whether there were hidden actors, such as the Public Prosecutor's Office, banks that finance agribusiness or local media, and whether any group would feel "too caricatured" in the drawing. That last one is, to me, the right question to ask about any AI-generated Rich Picture.
Hey João, but how do I know the AI isn't making things up?
That is what the separation between stated, inferred and to-be-confirmed is for. Both tools did it. ChatGPT listed as inferences, for example, that "large producers and companies may form circumstantial alliances" and that "local communities may have less formal decision power", and Gemini flagged as an inference that "the most critically disputed resource right now is water". These are reasonable hypotheses, and most importantly, they are labeled as hypotheses.
But the label also needs to be checked. Comparing the answers with the brief I kept on record, both tools list as "stated by the user" topics that are not in it. Community representation appears in both, and social justice in ChatGPT. Most likely the text sent was a slightly different version from the one I saved, and the record does not allow me to confirm it. The practical lesson is simple: keep the exported conversation, not just the brief. Without it, not even you can audit what the AI said you said.
Case 2: the system that "works as contracted"
In the second case, both tools treated the system rollout as a sociotechnical problem, not as a software failure. This matters more than it seems, because it is exactly the kind of reading a technical diagnosis tends to miss.
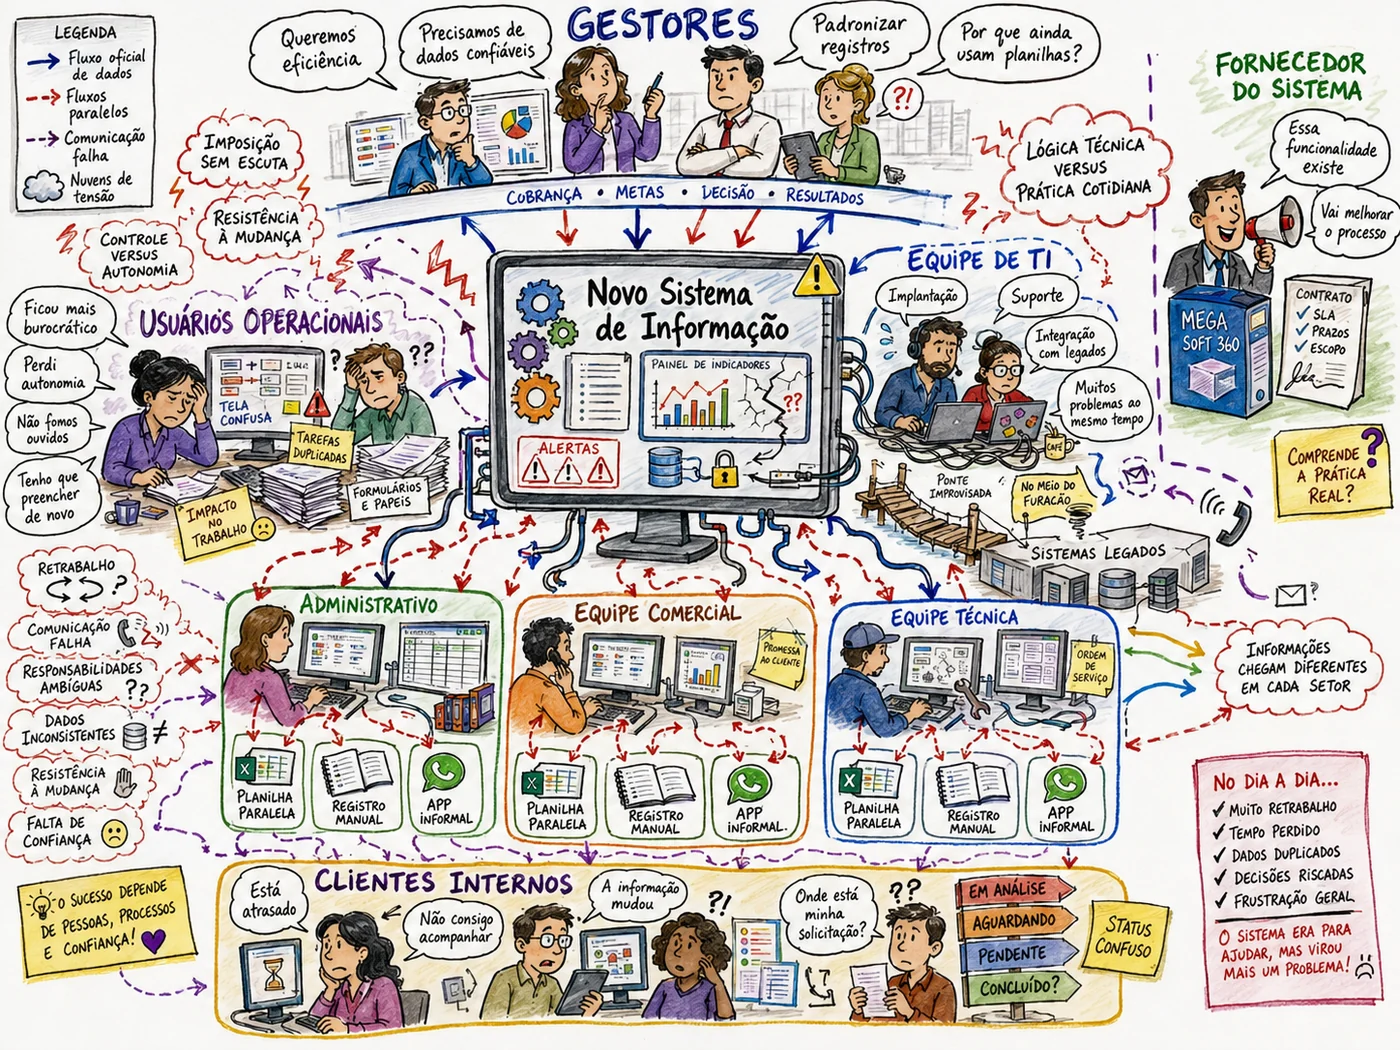
ChatGPT detailed managers, users, IT, vendor and internal clients, with arrows for the official data flow, the side flows and the broken communication. The side spreadsheet and manual record appear repeated in every department, which shows well that side tracking is not the exception, it is the routine. At the same time, the image brings details nobody asked for. The system got a name, "MEGA Soft 360", the brief's "internal departments" became administrative, sales and technical, and the informal app became WhatsApp. These are plausible details, but they are invented.
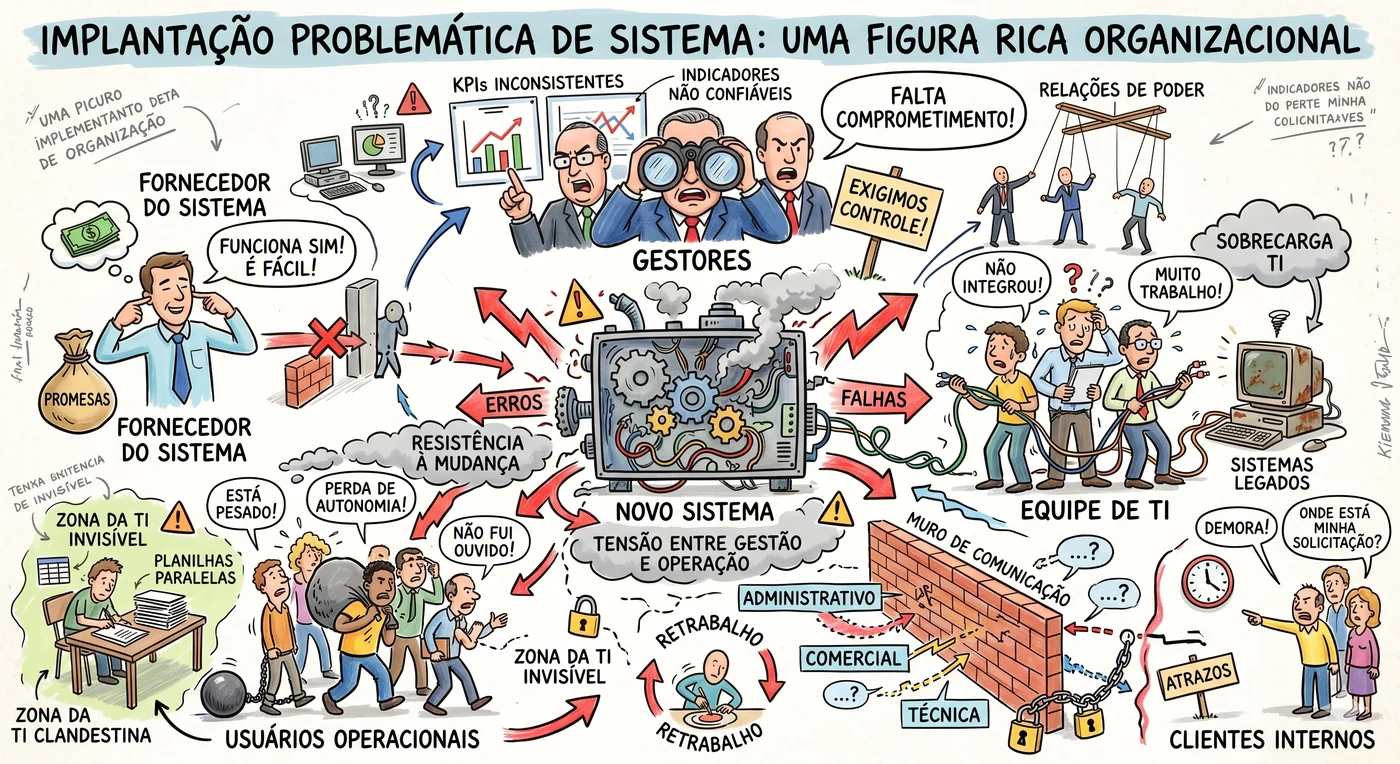
Gemini preferred strong metaphors, with a machine blowing smoke in the center, a chained communication wall, managers with binoculars and a puppet to represent power relations. It works to open the conversation about resistance and trust, but it has a clear risk. A metaphor that is too strong points fingers. If this picture were projected in a meeting with the managers, the discussion would probably be about the caricature, not about the problem.
Case 3: student dropout is not an individual decision
In the third case, both tools got right what matters most, which is not reducing dropout to a student's decision. Financial, pedagogical and institutional factors appear in both pictures.
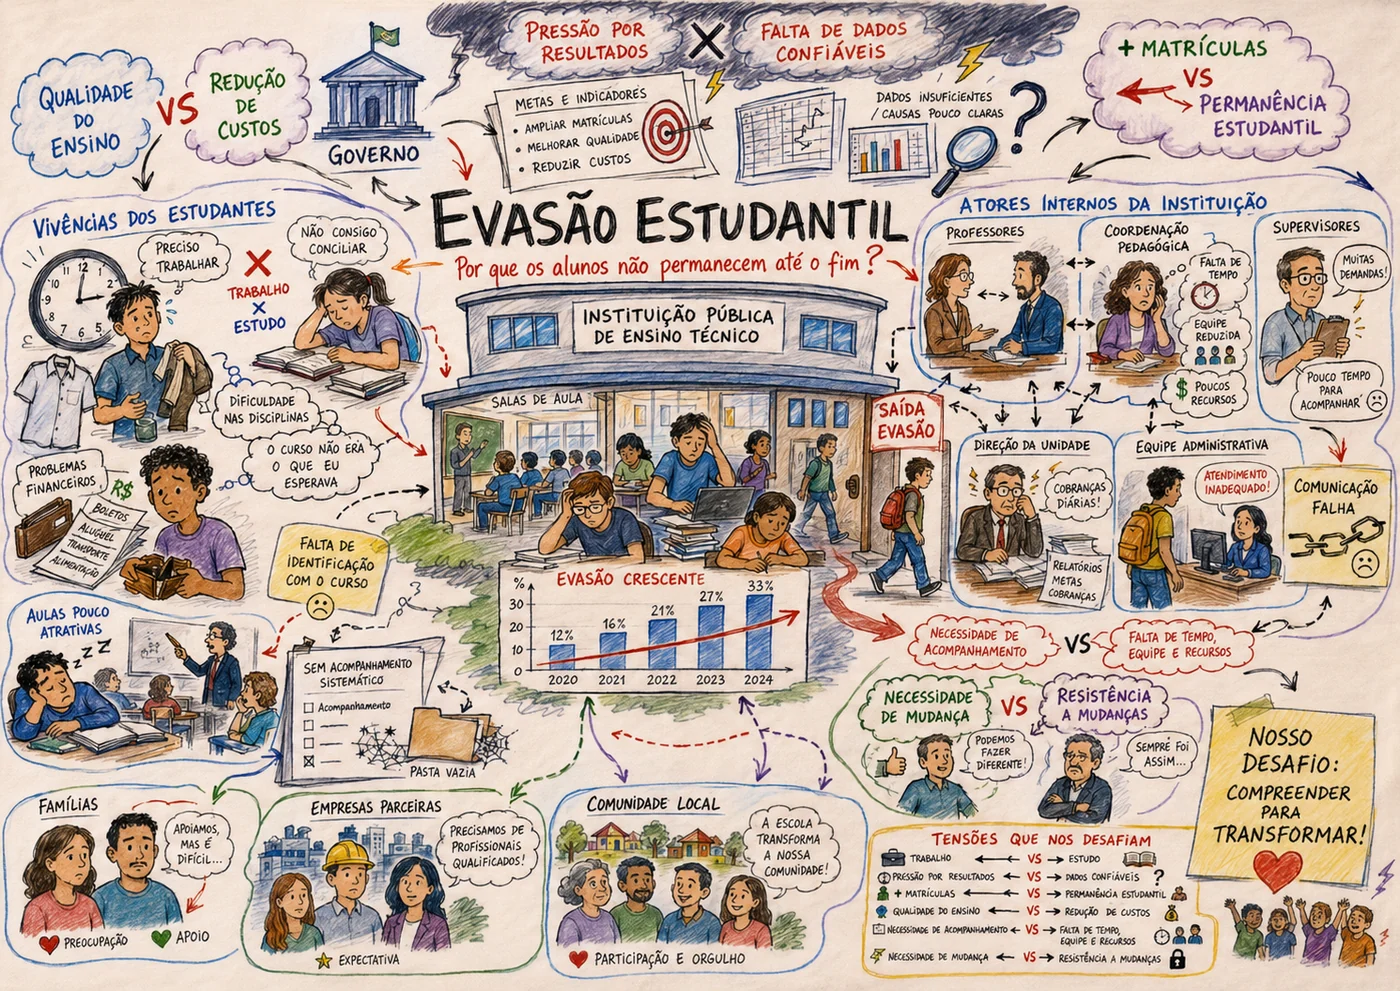
ChatGPT built a network, with students' experiences on one side, the institution's internal actors on the other, and a box of "tensions that challenge us" with pairs such as more enrollments versus student retention and pressure for results versus reliable data. It is the picture I would take to document the situation.
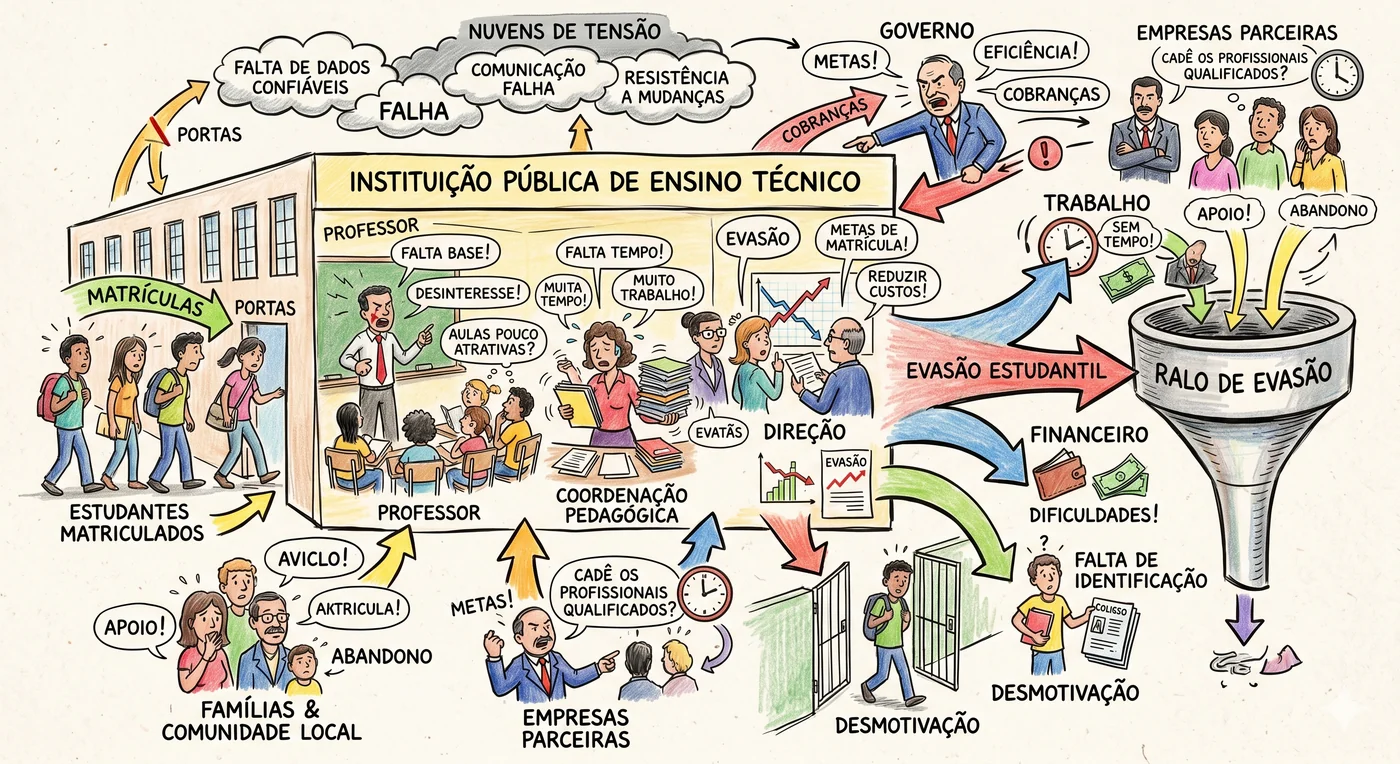
Gemini synthesized everything into a single image, in which students enter through the institution's door and drain through a funnel, the "dropout drain", pushed by work, financial hardship, lack of motivation and not identifying with the course. It is the picture I would take to start the conversation. On the other hand, it says little about how the internal actors relate to each other.
What the AI drew that nobody asked for
Looking at the images calmly, two problems appeared that are not in the texts and that change how I would use these pictures.
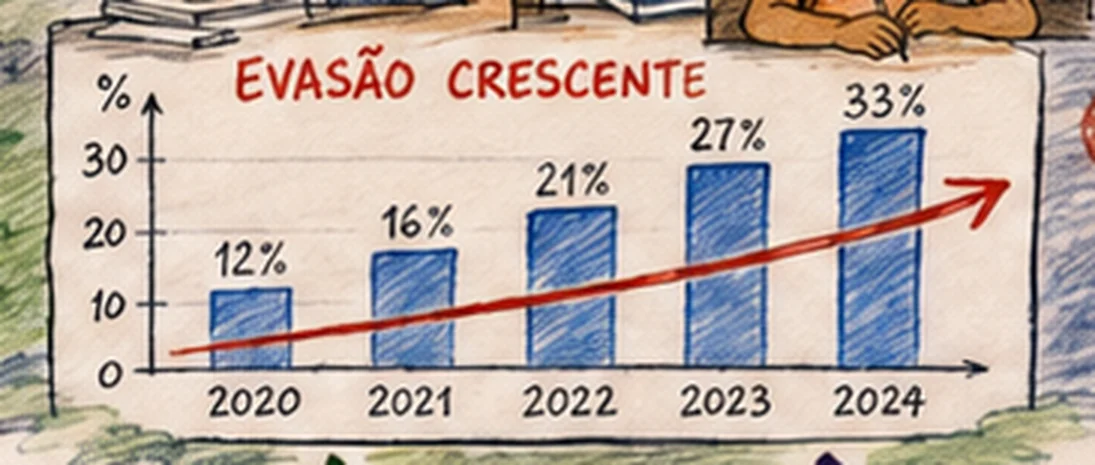
The first is in ChatGPT's dropout picture, a chart of "rising dropout", from 12% in 2020 to 33% in 2024. The brief had no numbers at all. The image generator created a statistic and drew it as if it were data. In day-to-day use, this chart would be read as fact, and someone could leave the meeting quoting the 33%.
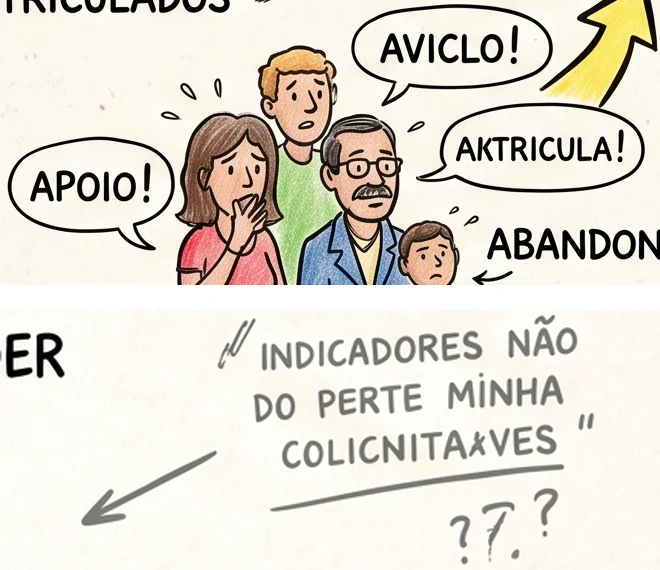
The second is in Gemini's images, with words that do not exist (even in Portuguese). In the dropout case, the family says "AVICLO!" and "AKTRICULA!"; in the system rollout, a note says "INDICADORES NÃO DO PERTE MINHA COLICNITAXVES". There are also "EVATÃS", "PROMESAS" and "ATRAZOS". It is not an isolated problem. Text-to-image models have a known difficulty writing legible labels, exactly the kind of element a diagram requires (Zala et al., 2024).
Both problems have the same root. Provenance labeling exists in the text, but it does not reach the image, because the drawing has no way of saying "this here is an inference". That is why the picture has to be reviewed element by element, not just by checking whether it "looks good".
Hey João, so can I use this day to day?
Yes, but as a draft, and with a review first. In practice, I would combine both outputs, using ChatGPT's analytical structure to make sure no actor was left out and to prepare the questions, and Gemini's metaphors to provoke the opening conversation. Before projecting any image, I would check three things: whether there are numbers or names that did not come from the group, whether the text is legible and whether any metaphor turns an actor into a villain.
Two styles that complement each other
Across the three cases, the pattern repeated. ChatGPT broke the situation down more, with more actors, flows and validation points, and Gemini concentrated the message into a few visual metaphors. Summing up what I observed:
| Aspect | ChatGPT | Gemini |
|---|---|---|
| Organization | More explicit categories and relations | More synthetic, metaphorical narratives |
| Visual representation | More annotations, actors and connections; denser | Central symbols and strong visual tensions |
| What to review | Legibility and origin of labels | Simplifications and the tone of the metaphors |
| Best use | Draft to document and prepare questions | Draft to provoke the opening discussion |
This does not mean one tool is better than the other. They serve different moments of facilitation, and the choice depends on what the group needs at that moment. The pattern also echoes what He et al. (2025) observed when comparing mind maps generated by language models with maps made by designers, in a study with 28 participants. According to them, the models capture the central concepts well, but struggle with hierarchical organization and grounding in context. It is a great start, but only a start.
Moving on: the agent became a skill
After this test, I kept developing the tool. The single prompt became a skill for Claude, a package of instructions the model loads when the request involves a Rich Picture. Instead of one agent doing everything, the skill orchestrates six roles, each with a narrow responsibility:
- Transcript analyzer: diagnoses meeting notes or the record of a conversation before structuring anything.
- Facilitator: separates facts, hypotheses and gaps, and asks the next minimal question.
- Knowledge reader: makes use of attached files, such as methodology material or material from the problem's domain.
- Designer: picks the form of representation, among a diagram, a drawing in code or an image generated by an external tool.
- Visual prompt: turns the structure into a detailed prompt for that external tool.
- Exporter: takes the result to workshop slides.
The separation exists for a reason the earlier test suggested. Understanding the problem and drawing the picture are different tasks and, when the same request mixes both, one of them comes out shallow. The other important decision is that the skill does not generate images with AI. It draws in code (SVG exported to PNG) or hands over a prompt for another tool. In the picture drawn in code, every word is written by the code itself, not guessed by an image generator.
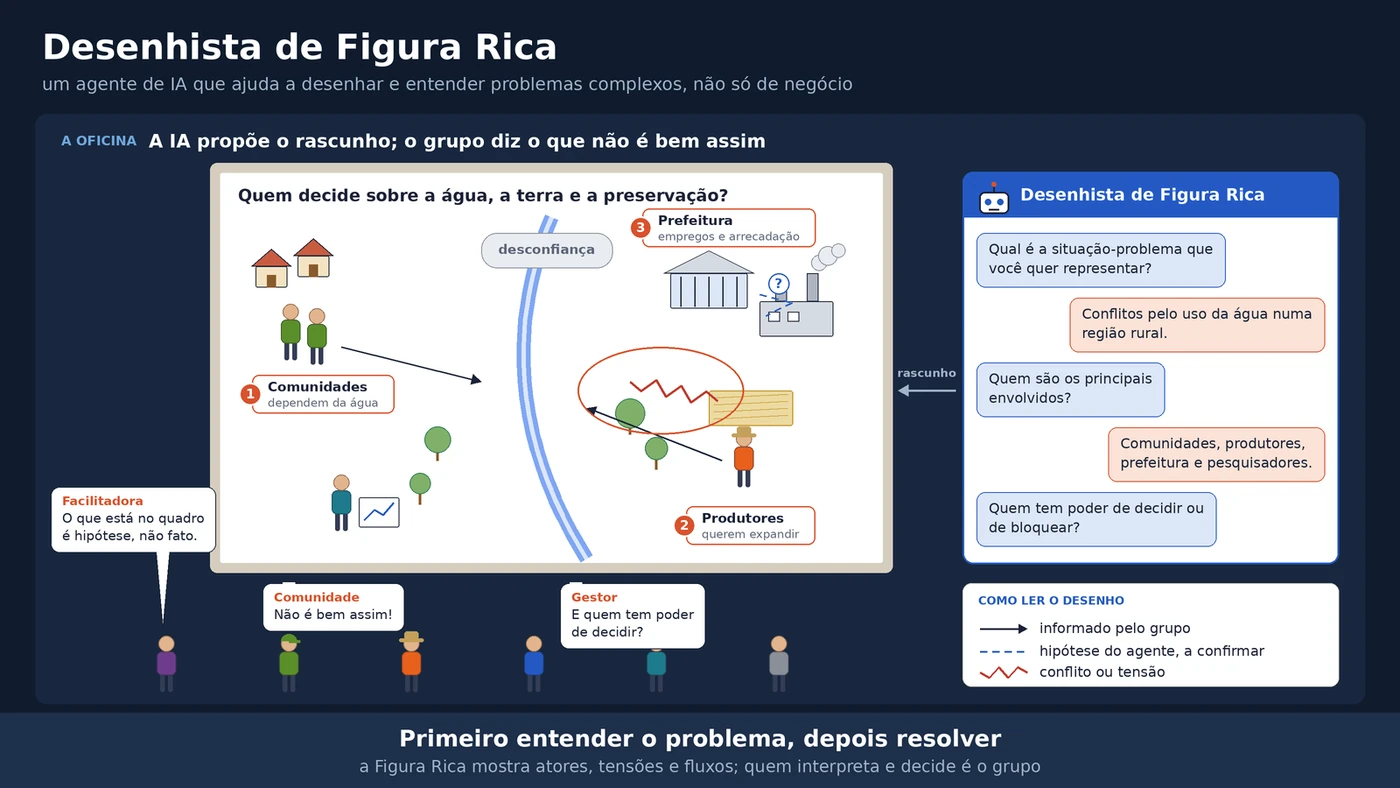
For the problem situation, the skill currently has the Provenance Scene style (Cena de Proveniência), in which the stroke of each link shows where the information came from, with a solid line for what was stated, dashed with "?" for a hypothesis and a red zigzag for conflict. This style was born during the round I show in the next section and only later went into the skill, along with the code that draws the pictures. The skill also follows the project after the diagnosis, with two more ready-made styles drawn in code. Column Architecture (Arquitetura em Colunas) shows where the data comes from, how it is processed and where it is consumed, and Illustrated Scene + Flow (Cena Ilustrada + Fluxo) serves to explain a solution to someone who does not know it yet, with the context drawn, the mechanism step by step and the full cycle.
If you want to try it, download the file figura-rica.skill. On Claude.ai, upload the file in the Skills area of the settings; in Claude Code, unzip the figura-rica/ folder into ~/.claude/skills/. The results for the three cases, with the specifications and the code that draws the pictures, are in the blog repository on GitHub. The skill and the pictures are in Portuguese.
The same three cases, now through the skill in Claude
I ran the skill in Claude Code, with Claude Opus 5.5, on 11/06/2026, in a loop over the same three briefs. Since each one already brought the situation, the actors, the central tension and the context, the facilitator considered the basis sufficient and went straight to the structure; then the designer built the picture in code.
Two caveats about this round. The roles ran in the conversation itself, one after the other, and not as separate subagents, as the skill's orchestrator foresees. And the stroke convention that appears in the pictures below was not yet written into the skill. It emerged as a visual suggestion from the facilitator and was formalized later, as the Provenance Scene style. Whoever downloads the skill today gets this convention ready-made, but that is not how these pictures were born.
This is an excerpt of the facilitator's output for the dropout case:
2. Hipóteses ou interpretações a confirmar
- A meta de ampliar matrículas pode competir com a atenção à permanência.
- A explicação dos professores (falta de interesse) e a dos estudantes (aulas pouco atrativas, trabalho) podem não estar se encontrando.
- A falta de acompanhamento sistemático pode ser a razão de a gestão não ter dados confiáveis.

3. Lacunas importantes
- Qual é a taxa de evasão e em quais cursos e turnos ela é maior (o enunciado não traz nenhum número).
- Se existe algum registro dos motivos de saída.
- Quando um aluno deixa de frequentar, quem percebe primeiro.
- O que as famílias e a comunidade local esperam da instituição.

4. Próxima pergunta mínima
Hoje, quando um aluno deixa de vir, quem fica sabendo primeiro e o que acontece depois?
In English, the facilitator lists as hypotheses that the enrollment target may compete with retention, that teachers' and students' explanations may not be meeting, and that the lack of systematic follow-up may be why management has no reliable data. The first gap is the dropout rate itself, since the brief has no numbers, and the next minimal question is "today, when a student stops coming, who finds out first and what happens next?".
Notice that first gap. Faced with the same brief, ChatGPT's image generator drew a chart from 12% to 33%; the facilitator recorded that there is no number at all and turned it into a question. And the next minimal question is the kind only someone inside the institution can answer, which is exactly what a Rich Picture is for in day-to-day use.
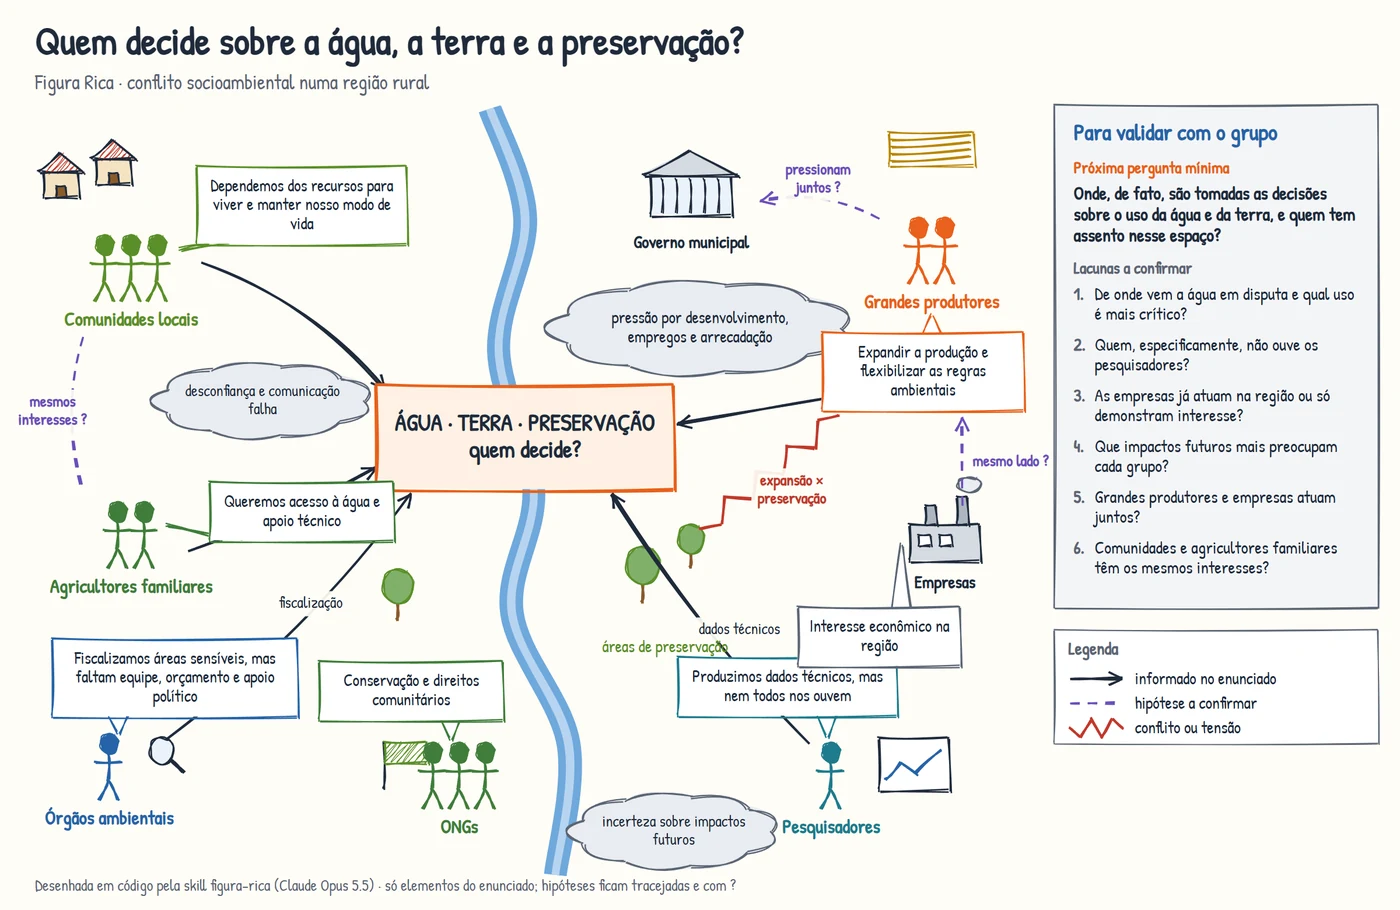
In the water case, the picture brings provenance into the drawing, which is what was missing from the earlier images. What was stated appears as a solid line, the facilitator's hypotheses as a dashed line with a question mark, and conflicts as a red zigzag. The doubt about communities and family farmers, which Gemini settled on its own by merging the two groups, here appears as a hypothesis ("mesmos interesses ?", same interests?) and comes back in the side panel as a question for the group.
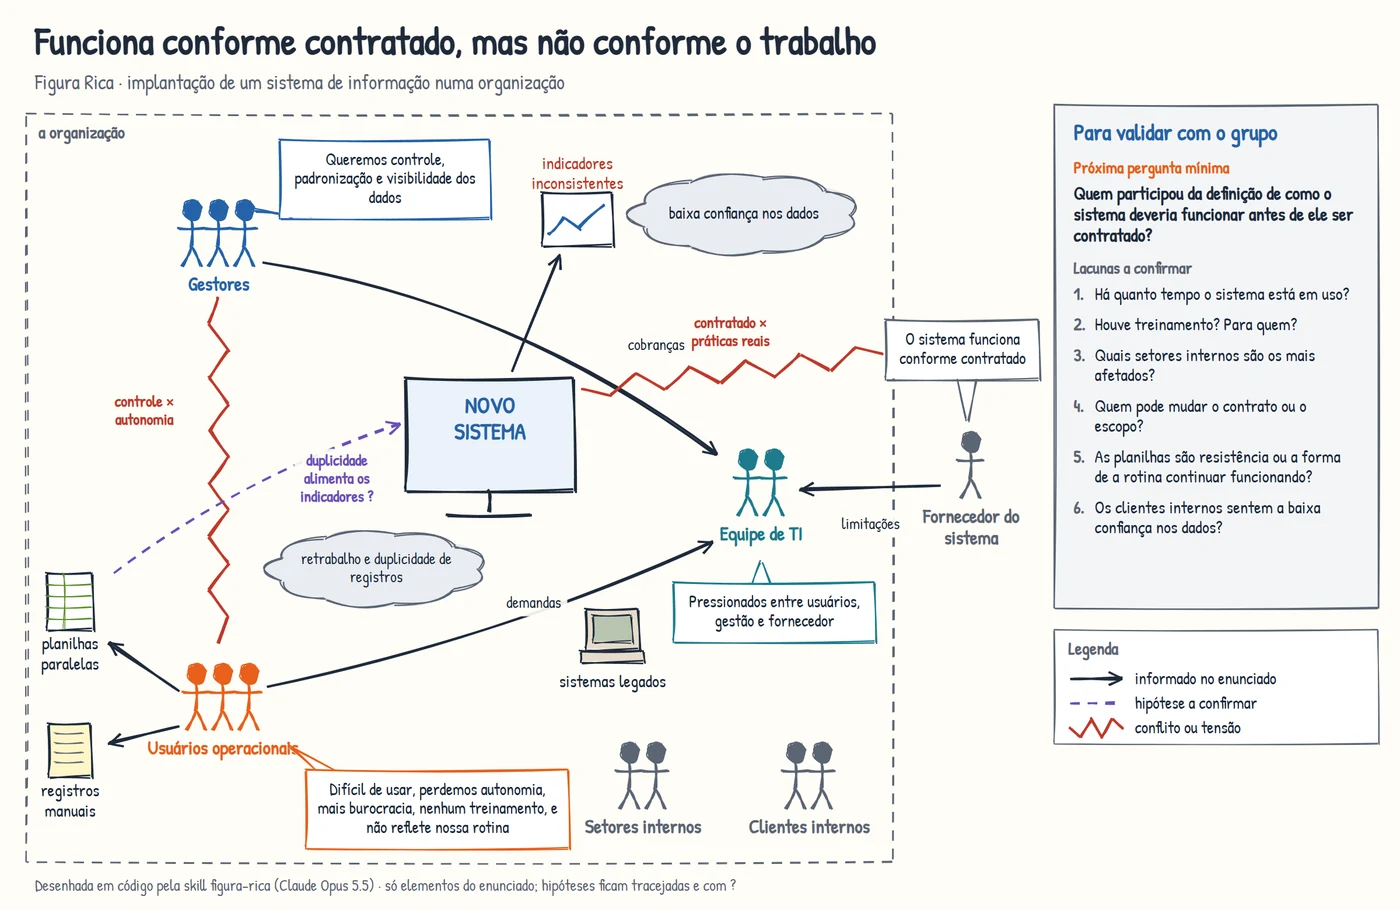
In the system case, nothing got a name the brief did not give. The system is just "new system", the departments remain "internal departments", and the vendor appears outside the organization's boundary, saying that "the system works as contracted". The idea that duplicate records feed the inconsistent indicators is there, but dashed, because it is a hypothesis.
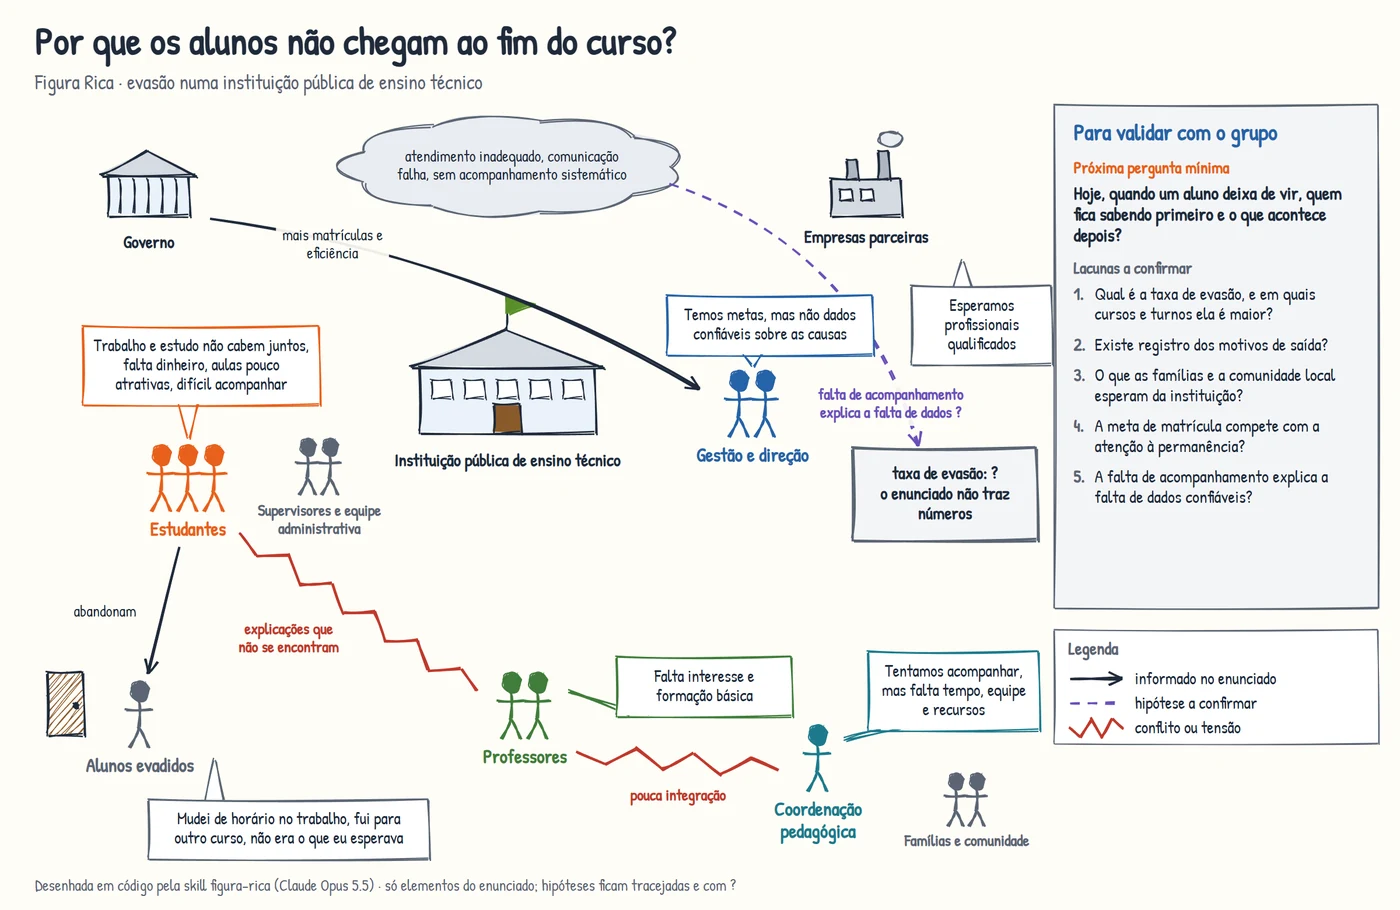
And, in the dropout case, instead of the invented chart, there is a box that says what is missing ("dropout rate: ? The brief has no numbers"). Teachers and students appear with the explanations each one gives, linked by a conflict labeled "explanations that don't meet".
Hey João, so the skill solved the problem?
No. It solved the problems I already knew about, and that comes at a cost. The pictures are more schematic. Stick figures and simple icons do not have the impact of the machine blowing smoke or Gemini's "dropout drain", and, in day-to-day use, that impact helps open the conversation. This simple stroke is a choice of the skill's initial version, not a limit of the tool. I know that, in Claude Code, you can ask for more advanced styles, in 3D and much more detailed. I did not ask for any of that because the focus was on bringing provenance into the drawing. Drawing in code also takes work, and the first version of each picture came out with overlapping labels and needed two or three rounds of position adjustment. That is what the skill instructs for the styles drawn in code, looking at the image before delivering it and fixing whatever overlaps.
The text was not free of unlabeled inference either. In the dropout case, the facilitator listed "a job market that competes for the student's time" as an external influence and "quality versus cost cutting" as a tension, without marking either as a hypothesis; the brief has quality and costs as goals, not as a conflict. These are small slips, but of the same kind I pointed out in ChatGPT and Gemini, and they are why the skill's facilitator now requires marking the origin item by item.
And the comparison is not blind. I wrote the skill after seeing ChatGPT's and Gemini's failures, and it was Claude itself that ran the roles and drew the pictures, in the same session in which I was comparing the results knowing what to look for. Summing up what I observed in the three outputs:
| Aspect | ChatGPT | Gemini | Skill in Claude |
|---|---|---|---|
| Invented numbers or names in the picture | Chart with dropout rates; system name | None found | None; gaps become questions |
| Unlabeled inference in the text | Topics outside the recorded brief given as stated (case 1) | Same (case 1) | Two inferences not marked as hypotheses (case 3) |
| Text in the picture | Legible | Words that don't exist | Exact, written in code |
| Provenance in the image | Only in the text | Only in the text | In the legend and the line strokes |
| Expressiveness | Dense, almost a map | Strong metaphors | Schematic |
| Effort to get the picture | One generation | One generation | Two or three rounds of adjustment |
What this experiment does not show
I want to be honest about its scope. There were three hypothetical situations, one run per case and per tool, and the reading was done only by me, without other evaluators. There was no formal evaluation with participants. I already use the skill day to day, and it has helped me, but that is my experience, not a measure of how much the pictures help a group understand the problem better or save facilitation time.
I also did not evaluate the text stage and the image stage separately. When an image has an error, there is no way to tell whether it came from the text proposal or from the drawing. And, since the brief was complete, the agent's conversational part went untested, both in the original prompt and in the skill, where the facilitator went straight to the structure. In the round with the skill, the orchestration into subagents also went untested, because the roles ran in the same conversation. In addition, the provenance convention was written into the skill after the pictures, not before. Since I already use the skill day to day, the natural next step is to record that use, letting the facilitator lead the conversation, noting what people correct and comparing it with what the AI proposed.
Conclusion
I started this project wanting a way to see problems before trying to solve them, and the Rich Picture already solved half of that. The Rich Picture Designer agent tries to help with the other half, which is the work of organizing the conversation and proposing a first drawing. In the three cases, it played that draft role well, and both tools read the situations as systemic problems, with many actors, not as technical ones.
But the experiment also showed why human review is not optional. The AI invented a chart with numbers, named a system, wrote words that do not exist and, at times, decided what it should have asked. In the round with the skill, some of these problems did not show up, because the text in the picture is written in code, gaps become questions and provenance goes into the line strokes. Since each picture also went through two or three rounds of review looking at the image, there is no way to separate how much of this comes from drawing in code and how much from that review. The cost was less expressive pictures and more adjustment work. It is worth using when you need a starting point for a conversation with many actors, whether in a company, a school or a territory. That is how I already use the skill day to day, and it has helped me. It is not worth it when the picture will circulate on its own, with no one there to say what is data and what is a guess.
In the end, the best an agent like this can do is not to draw the right problem, but to draw a problem good enough for someone in the group to raise their hand and say, "that's not quite how it is".
References
BELL, Simon; MORSE, Stephen. How People Use Rich Pictures to Help Them Think and Act. Systemic Practice and Action Research, v. 26, n. 4, p. 331-348, 2013. DOI: 10.1007/s11213-012-9236-x
CHECKLAND, Peter; POULTER, John. Soft Systems Methodology. In: REYNOLDS, Martin; HOLWELL, Sue (ed.). Systems Approaches to Making Change: A Practical Guide. London: Springer, 2020. p. 201-253. DOI: 10.1007/978-1-4471-7472-1_5
CONTE, Kathleen P.; DAVIDSON, Seanna. Using a 'rich picture' to facilitate systems thinking in research coproduction. Health Research Policy and Systems, v. 18, n. 1, art. 14, 2020. DOI: 10.1186/s12961-019-0514-2
HE, Tianhao; SARAVANAN, Karthi; NIFORATOS, Evangelos; KORTUEM, Gerd. "A Great Start, But...": Evaluating LLM-Generated Mind Maps for Information Mapping in Video-Based Design. In: Extended Abstracts of the CHI Conference on Human Factors in Computing Systems. Yokohama: ACM, 2025. p. 1-7. DOI: 10.1145/3706599.3719940
LEWIS, P. J. Rich picture building in the soft systems methodology. European Journal of Information Systems, v. 1, n. 5, p. 351-360, 1992. DOI: 10.1057/ejis.1992.7
ZALA, Abhay; LIN, Han; CHO, Jaemin; BANSAL, Mohit. DiagrammerGPT: Generating Open-Domain, Open-Platform Diagrams via LLM Planning. arXiv:2310.12128, 2024. DOI: 10.48550/arXiv.2310.12128