

Updated 2026 (published in 2020)
Forecasting dengue cases with Prophet, ARIMA and ETS: 10 capitals, 4 weeks ahead

Translated from the original Portuguese article. Ler o original em português

We already hear that Prophet solves series with seasonality, and it is true that it handles series that repeat every year well. But I wondered how it fares on a series that does not repeat itself properly, like dengue cases, which come in waves and have epidemic years and years with almost no cases. I wanted to know whether it beats simply repeating the last week, and whether the climate helps.
I set up the test with 10 Brazilian capitals, 4-week-ahead forecasts and a decision rule written before running, so as not to pick the criterion after seeing the result. Prophet erred 2.3 times more than repeating the last week, ARIMA and ETS gained only about 5%, and a LightGBM trained with the 10 capitals together gained 15% in validation (the period in which I saw the result), but in the test (the most recent dates) it has not confirmed yet. The lagged climate and Rt (reproduction number) did not help. I show the path and the limits.
The code is in the blog repository on GitHub, and the data come from a download script.
The data
The cases come from InfoDengue, an arbovirus alert system by Fiocruz and FGV with an open API. I downloaded the weekly series of 10 capitals (Recife, Rio de Janeiro, São Paulo, Belo Horizonte, Fortaleza, Salvador, Goiânia, Manaus, Curitiba and Campo Grande), from January 2010 to November 2026, with the estimated cases already corrected for notification delay and the weekly climate (mean temperature and humidity). I drop the last 4 weeks, because their estimate is still provisional, which leaves 876 weeks per capital.
The forecast series is log(1 + estimated cases), which flattens the peaks and works even with zero cases. The climate gaps were filled by interpolation.
g = g.sort_values("data_iniSE").iloc[:-4].set_index("data_iniSE")     # tira as 4 semanas provisórias
g["y"] = np.log1p(g["casos_est"])
g[["tempmed", "umidmed"]] = g[["tempmed", "umidmed"]].interpolate(limit_direction="both")
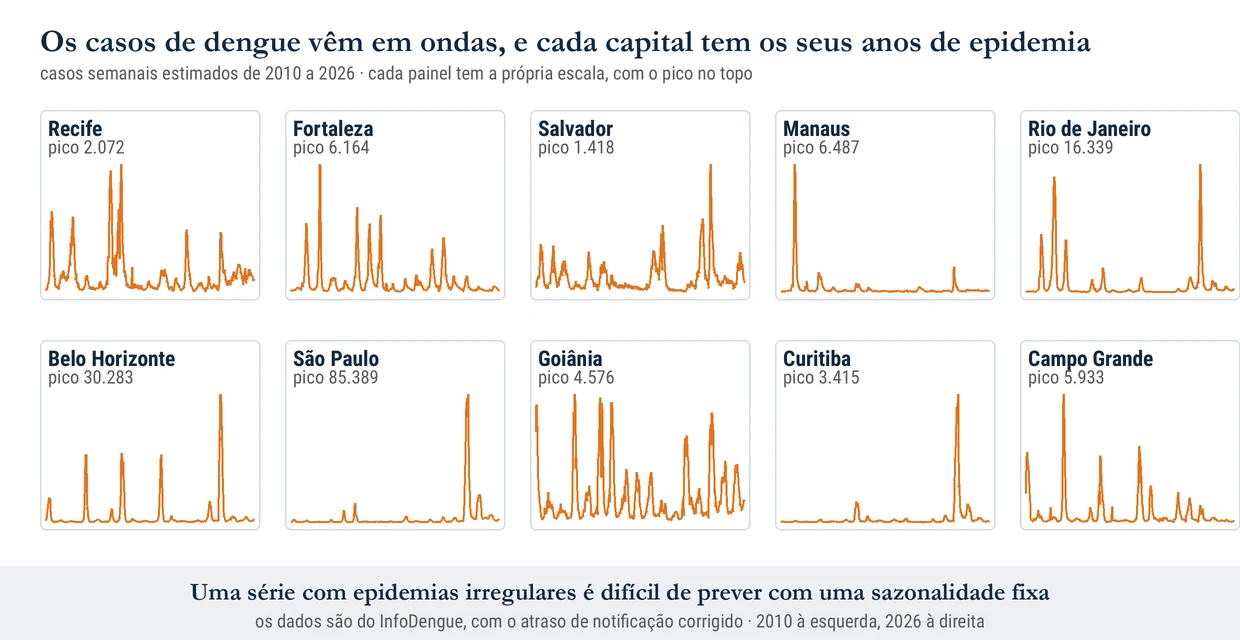
Figure 1 shows the 10 series, each on its own scale. The peaks are very different across capitals (from 1.4 thousand cases per week in Salvador to 85 thousand in São Paulo), and the epidemic years do not coincide.
The question and the protocol
The question is which model forecasts cases best 4 weeks ahead, and whether the climate helps. I compare nine models, in four families. Two of them came in after the first round, and I mark which.
- References: Last value (reference) and Same week of the previous year.
- Statistical: ARIMA, ETS and ARIMA with climate.
- Machine learning: global LightGBM (added later), global LightGBM with Rt (added later) and per-capital LightGBM.
- Prophet.
ARIMA and ETS come from AutoHybTS, an open-source time series library. The ARIMA with climate uses temperature and humidity lagged by 4 and 8 weeks, known at the time of the forecast. Rt is the InfoDengue estimate of how many people each case infects. The global LightGBM is a single model trained with the series of the 10 capitals together, the per-capital one is a model for each city, with the last 8 weeks of cases and climate, and Prophet uses annual seasonality.
The global LightGBM predicts something different from the others. Instead of predicting the value, it predicts how much the series goes up or down relative to the last week (the change in the log of the cases).
To evaluate, I simulate the past. At the first cutoff date, the model trains only on what came before it and forecasts the next 4 weeks. 8 weeks later, I repeat with more data, and so on. Each cutoff date is an origin, and there are 40 per capital. The first 34 origins are the validation, the period in which I see the result, and the last 6 are the test, which repeats the measurement on more recent dates.
The error of each origin is the average, over the 4 forecast weeks, of the absolute difference between the forecast and the real value, on the log scale. For each capital, I sum those errors over all the origins and divide by the sum of the errors of repeating the last week. I call that result the error relative to the last value. Less than 1 means the model beats the reference, and 0.85 is 15% less error. I summarize by the median across the capitals.
The confidence interval is the uncertainty of that median, estimated by resampling the 10 capitals (the so-called bootstrap).
The rule, written beforehand, asks for three things for a model to be considered better. The median has to be below 1, the whole interval has to stay below 1 in validation, and the test must not contradict that. The protocol did not say in numbers what contradicting would be, so, when reading the test, I describe what it showed in each case.
For the climate, the criterion is the same. It is only considered useful if the ARIMA with climate beats the ARIMA without climate.
exp = AutoHybridExperiment(fh=4, session_id=42, test_size=0, exog_lags={"tempmed": [4, 8], "umidmed": [4, 8]}).fit(y, g[["tempmed", "umidmed"]])
cv = exp.cross_validate(models=[exp.create_model("arima", exog=True)], folds=40, step=8)

m = Prophet(yearly_seasonality=True, weekly_seasonality=False, daily_seasonality=False).fit(treino)
previsao = m.predict(futuro).yhat.values
What the numbers show
| Model | Validation, median (95% CI) | Capitals that win | Test, median (95% CI) |
|---|---|---|---|
| LightGBM global | 0.85 (0.81 to 0.94) | 9 of 10 | 0.94 (0.86 to 1.05) |
| LightGBM global with Rt | 0.86 (0.81 to 0.95) | 9 of 10 | 0.95 (0.86 to 1.06) |
| ARIMA | 0.95 (0.90 to 0.96) | 10 of 10 | 0.91 (0.89 to 1.02) |
| ETS | 0.95 (0.88 to 0.99) | 8 of 10 | 1.02 (0.90 to 1.14) |
| ARIMA with climate | 0.96 (0.93 to 0.98) | 8 of 10 | 0.94 (0.93 to 1.01) |
| Last value (reference) | 1.00 | 1.00 | |
| LightGBM per capital | 1.01 (0.99 to 1.11) | 5 of 10 | 0.99 (0.87 to 1.10) |
| Prophet | 2.29 (2.12 to 3.07) | 0 of 10 | 2.82 (2.45 to 4.58) |
| Same week of the previous year | 3.10 (2.59 to 3.57) | 0 of 10 | 1.93 (1.84 to 2.70) |
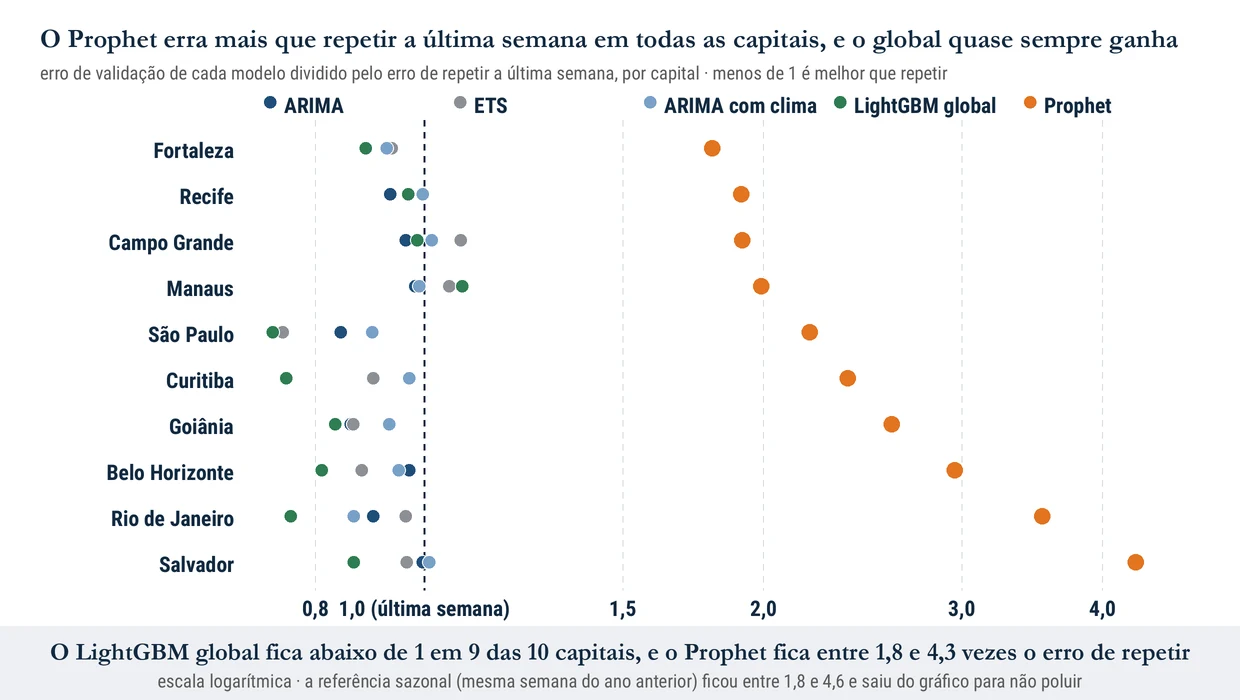
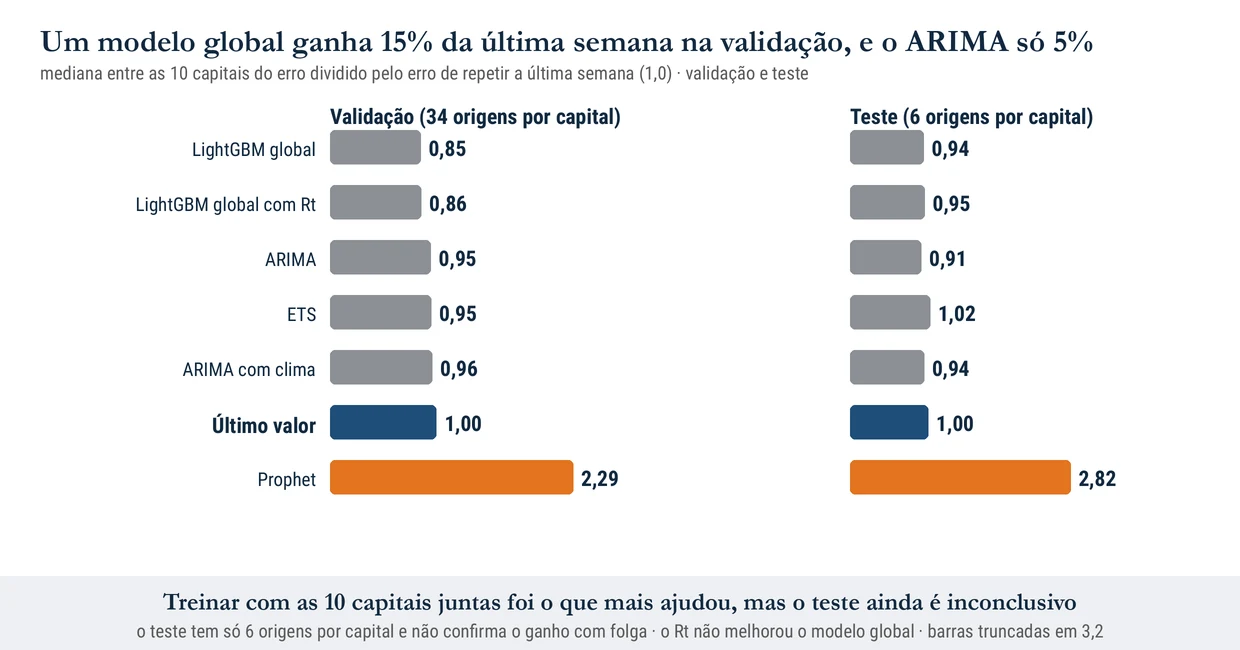
The global LightGBM is the best in validation, with 15% less error than repeating the last week, and it beats the reference in 9 of the 10 capitals. My hypothesis is that training with the 10 capitals together helped, since each capital has few epidemic years and the single model learns from those of all of them. But the gain may also come from predicting the change instead of the value, and I did not test which of the two weighs more.
The test, however, does not confirm it with room to spare. The global LightGBM median is 0.94, and the interval goes from 0.86 to 1.05, with a win in 6 capitals. There are only 6 origins per capital, and the ARIMA did better on the test (0.91). By the rule I wrote before, the global LightGBM is the best candidate, and it is not yet a firm result.
ARIMA and ETS pass the validation rule, but the gain is small.
Prophet sits at the other extreme. In validation, it errs more than the reference in all 10 capitals, between 1.8 and 4.3 times more, and on the test the median rises to 2.8. The seasonal reference also errs a lot, which confirms that the same week of the previous year says little about this year's epidemic.
Ah João, so Prophet does not work?
The way I used it, it did not. I used Prophet with the basic configuration, only with yearly seasonality, without holidays, without external variables and without tuning anything. Dengue does not repeat the same pattern every year, and the average seasonal pattern it learns misses the height of each epidemic. The result says that this configuration does not serve for this problem, and not that Prophet would not serve with more care. I did not test that.
The climate did not help either. The ARIMA with climate ended at 0.96 in validation, against 0.95 for the ARIMA without climate, and under the rule I wrote it does not pass as useful. The Rt from InfoDengue also did not improve the global model (0.86 against 0.85). I used only temperature and humidity at two lags, and other lags or rainfall could give another result.
Limits of the test
The cases are notifications, and the InfoDengue estimate corrects the delay, but not underreporting (the cases that were never notified). The 10 capitals have epidemics in different years, and there are few epidemic years per capital, so the confidence interval over 10 capitals is wide. The last validation origin forecasts 4 weeks that may already fall in the test period. There is also a selection bias. Two of the nine models, the global LightGBM and the global LightGBM with Rt, came in after the first round, which is recorded in the protocol, and since they were chosen after seeing results they have one extra chance of having been favored.
The horizon is 4 weeks, and for longer horizons the result may be different. Rt was used as it came from the API, and it may be revised after the week. I did not use an epidemiological model, which would be the fairest comparison for a disease with waves.
What comes next
The next round is to follow the global LightGBM over the coming weeks and see whether it stays below 1, and to return to Prophet only with holidays, external variables and tuning, always against the reference of repeating the last week.
References
TAYLOR, Sean J.; LETHAM, Benjamin. Forecasting at scale. The American Statistician, v. 72, n. 1, p. 37-45, 2018. DOI: 10.1080/00031305.2017.1380080
INFODENGUE. Arbovirus alert system. Fiocruz and Fundação Getulio Vargas. Available at info.dengue.mat.br.


