Airbnb Data Analysis - Toronto, Canada

Translated from the original Portuguese article. Ler o original em português

Airbnb is already considered the largest hospitality company in the world today. Yet it does not own a single hotel! The company's main differentiator is connecting people who want to travel (and find a place to stay) with hosts who want to rent out their properties in a practical way. Airbnb provides an innovative platform that makes this alternative form of lodging possible.
By the end of 2018, while still a startup, it had already hosted more than 300 million people around the world, challenging traditional hotel chains. One of the company's initiatives was to open up data for the world's main tourist cities. Through the Inside Airbnb portal, you can download a large amount of data to develop Data Science projects and solutions.
Toronto is the capital of the province of Ontario and one of the most important Canadian cities, known for its winter tourism and for being a dynamic metropolis with a core of skyscrapers, as well as plenty of green spaces, from the well-kept oval of Queen's Park to the 400-acre High Park and its trails.
With that in mind, this project aims to carry out an exploratory data analysis to extract insights about the services offered by Airbnb in the city of Toronto, Canada. The project was inspired by an exercise from Carlos Melo's Data Science na Prática course. The complete work can be seen in the Notebook.
The dataset, dated May 7, 2020, is a summarized version with many variables to analyze, so the first step was to get to know its data dictionary and understand the meaning of each column name.
- id - ID number generated to identify the property
- name - name of the listed property
- host_id - ID number of the property's owner (host)
- host_name - name of the host
- neighbourhood_group - this column contains no valid values
- neighbourhood - name of the neighborhood
- latitude - latitude coordinate of the property
- longitude - longitude coordinate of the property
- room_type - type of room offered
- price - price to rent the property
- minimum_nights - minimum number of nights to book
- number_of_reviews - number of reviews the property has
- last_review - date of the last review
- reviews_per_month - number of reviews per month
- calculated_host_listings_count - number of properties from the same host
- availability_365 - number of days available within 365 days
Likewise, before starting any analysis, we will take a look at what our dataset "looks like" by examining its first 5 entries, as shown below:
| id | name | host_id | host_name | neighbourhood_group | neighbourhood | latitude | longitude | room_type | price | minimum_nights | number_of_reviews | last_review | reviews_per_month | calculated_host_listings_count | availability_365 | |
|---|---|---|---|---|---|---|---|---|---|---|---|---|---|---|---|---|
| 0 | 1419 | Beautiful home in amazing area! | 1565 | Alexandra | NaN | Little Portugal | 43.64617 | -79.42451 | Entire home/apt | 470 | 4 | 7 | 2017-12-04 | 0.12 | 1 | 0 |
| 1 | 8077 | Downtown Harbourfront Private Room | 22795 | Kathie & Larry | NaN | Waterfront Communities-The Island | 43.64105 | -79.37628 | Private room | 105 | 180 | 169 | 2013-08-27 | 1.30 | 2 | 0 |
| 2 | 12604 | Seaton Village Parlour Bedroom | 48239 | Rona | NaN | Annex | 43.66724 | -79.41598 | Private room | 70 | 1 | 0 | NaN | NaN | 1 | 0 |
| 3 | 23691 | Queen Bedroom close to downtown | 93825 | Yohan & Sarah | NaN | Briar Hill-Belgravia | 43.69602 | -79.45468 | Private room | 72 | 1 | 217 | 2019-12-22 | 1.79 | 2 | 0 |
| 4 | 26654 | World Class downtown @CN Tower Theatre MTCC ga... | 113345 | Adela | NaN | Waterfront Communities-The Island | 43.64530 | -79.38940 | Entire home/apt | 169 | 4 | 40 | 2020-03-20 | 0.35 | 5 | 365 |
This way, I was able to inspect the data and then come up with a few questions to get to know the dataset, such as:
-
How many attributes (variables) and how many entries does our dataset have?
-
What is the percentage of missing values in the dataset?
-
What type of distribution do the variables have?
-
What is the most rented property type on Airbnb?
-
What is the most expensive area in the city of Toronto?
For the first question, it turned out that most variables have few missing values; however, the neighbourhood_group column is 100% missing, as we can see below:
neighbourhood_group               1.000000
reviews_per_month                 0.193147
last_review                       0.193147
host_name                         0.000092
name                              0.000046
availability_365                  0.000000
calculated_host_listings_count    0.000000
number_of_reviews                 0.000000
minimum_nights                    0.000000
price                             0.000000
room_type                         0.000000
longitude                         0.000000
latitude                          0.000000
neighbourhood                     0.000000
host_id                           0.000000
id                                0.000000
dtype: float64
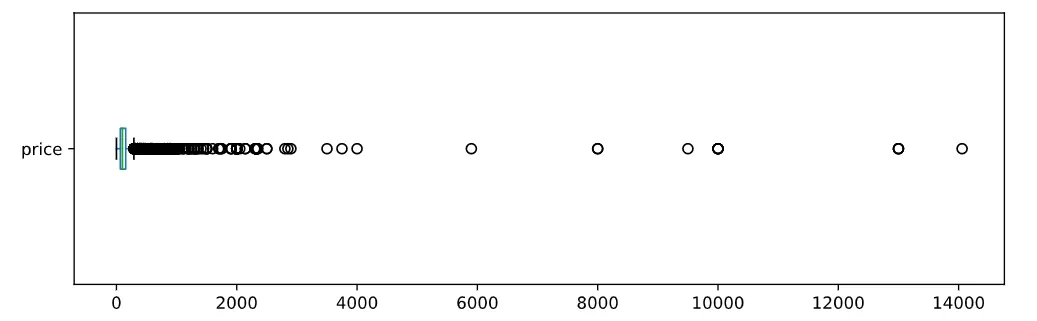
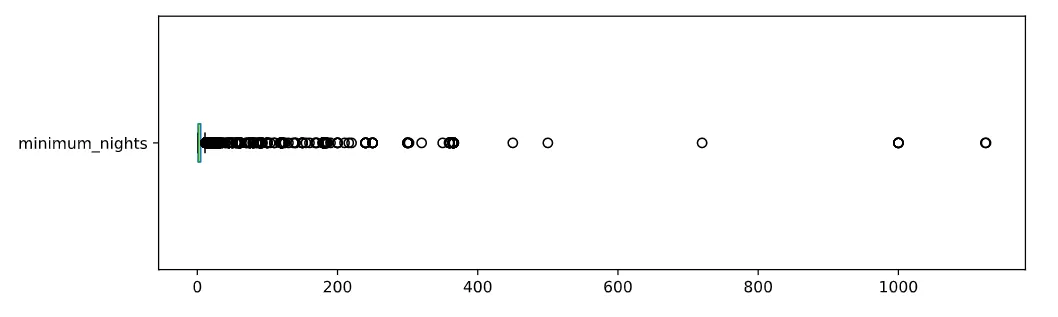
In addition, I computed their summary statistics, which led me to raise some hypotheses. As we can see, the price and minimum nights variables show signs of abnormal values, called outliers, because they have characteristics such as:
| price | minimum_nights | number_of_reviews | reviews_per_month | calculated_host_listings_count | availability_365 | |
|---|---|---|---|---|---|---|
| count | 21771.000000 | 21771.000000 | 21771.000000 | 17566.000000 | 21771.000000 | 21771.000000 |
| mean | 144.614855 | 8.520417 | 28.167976 | 1.490266 | 5.064489 | 118.803822 |
| std | 297.619621 | 30.923437 | 53.018686 | 1.817760 | 12.230018 | 131.096867 |
| min | 0.000000 | 1.000000 | 0.000000 | 0.010000 | 1.000000 | 0.000000 |
| 25% | 65.000000 | 1.000000 | 1.000000 | 0.260000 | 1.000000 | 0.000000 |
| 50% | 100.000000 | 2.000000 | 7.000000 | 0.770000 | 1.000000 | 83.000000 |
| 75% | 155.000000 | 5.000000 | 30.000000 | 2.050000 | 4.000000 | 201.000000 |
| max | 14058.000000 | 1125.000000 | 820.000000 | 14.620000 | 118.000000 | 365.000000 |
- The price variable has 75% of its values below 155.00, but its maximum value is 14058.00, indicating the presence of outliers (abnormal values).
- The minimum number of nights (minimum_nights) goes beyond the 365 days of a year, reaching a maximum of 1125.00, with a standard deviation of 30.92 days.
However, to be more certain, we will plot the boxplot. Prices above U$2000.00 add up to 100 entries, approximately 0.4593%.
Minimum nights above 30 days add up to 560 records, approximately 2.58% of the dataset.
So we performed the necessary cleaning, such as removing the neighbourhood_group column and applying a filter to the price and minimum nights variables. This gave us the histograms that illustrate the distribution of each attribute.
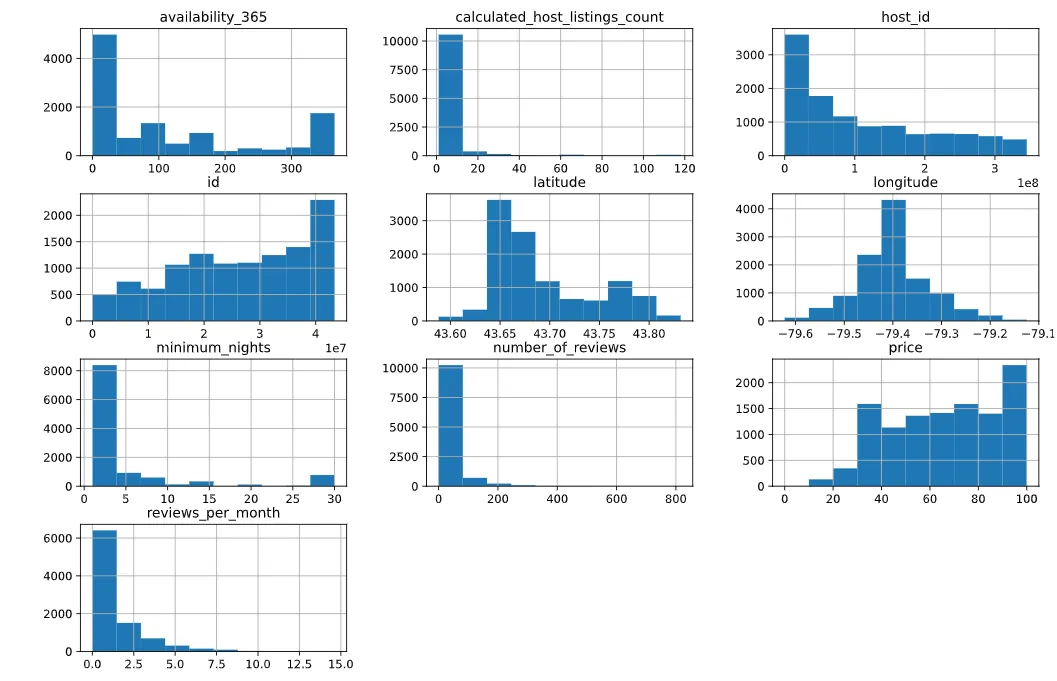
I then noticed that most of the distributions are not normal. The next question was: "What is the most rented property type on Airbnb?". The company offers options of entire apartments/houses, renting just a room, or even sharing a room with other people. So we will count the occurrences of each rental category and the percentage of available properties for each type.
Private room       56.0%
Entire home/apt    40.41%1
Shared room         3.28%
Hotel room          0.29%0
Name: room_type, dtype: float64
So I noticed that most people prefer private rooms, followed by an entire home/apartment. My assumption was that, since the minimum rental is around 30 days, they prefer comfort. Last but not least: "What is the most expensive area in the city of Toronto?". To answer it, I applied a filter that computes the average price per neighborhood.
neighbourhood
Waterfront Communities-The Island      84.322398
Niagara                                80.253378
Rosedale-Moore Park                    78.976190
Bay Street Corridor                    78.543779
North Riverdale                        77.846154
Annex                                  76.778075
Danforth East York                     75.745098
Kingsway South                         75.666667
Church-Yonge Corridor                  75.492248
Runnymede-Bloor West Village           73.900000
Moss Park                              73.671053
Forest Hill South                      73.166667
Mimico (includes Humber Bay Shores)    72.007042
Yonge-St.Clair                         71.952381
The Beaches                            71.768421
Name: price, dtype: float64
The result is that the average prices are very close to each other, giving an almost normal distribution across neighborhoods, as we can see in the histogram below:
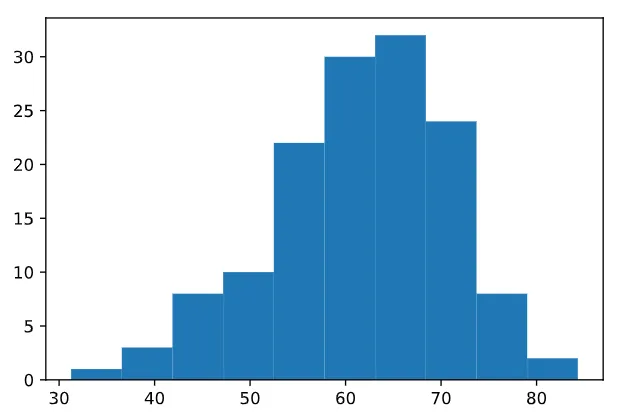
However, when I plotted their spatial distribution, it showed a concentration in the central region of the city, where most of the tourist attractions and universities are located, as we can see below:
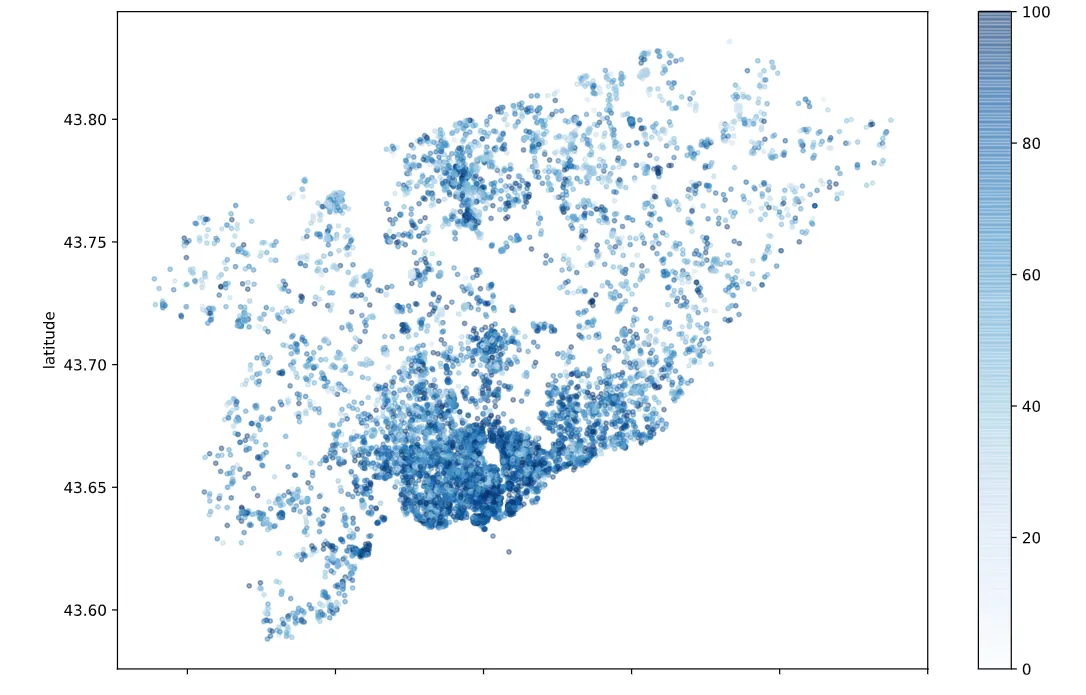
This work was only a superficial exploratory analysis of the Airbnb dataset for the city of Toronto, Canada, in which some outliers were found in its variables. We also observed an uneven distribution of properties, with a concentration in the downtown areas, and a normal distribution of prices across neighborhoods.
Finally, it is important to remember that this dataset is a summarized version, which is ideal for an initial analysis. A more thorough analysis of the full dataset remains a future goal.