Forecasting Animal Adoptions with Prophet

Translated from the original Portuguese article. Ler o original em português

Something that has always interested me is environmental preservation, especially our wildlife. There was a time when I was a vegetarian, and, due to some issues that aren't relevant here, today I help in other ways: raising awareness about preservation and feeding and caring for stray animals.
Thinking about this reminds me of my university, where our education coordinator, Hortência Pessoa, and other collaborators run the Unidos Pelas Patinhas project. The project takes animals off the streets, especially dogs and cats, vaccinates them and cares for them until someone adopts them.
Inspired by this, when I saw the hands-on project from Carlos Melo's Data Science school, I didn't waste any time applying Machine Learning tools, in particular Facebook's Prophet framework, to forecasting animal intakes and outcomes at institutions like this one.
However, the Unidos Pelas Patinhas initiative doesn't have a large, organized database, so I'll use the Austin Animal Center dataset. This American institution provides public animal control services for stray animals or those that got lost from their owners, offering water, shelter and veterinary care, work very similar to that of the Brazilian NGO.
The data provided by the institution is from April 30, 2020, and contains 117K entries and 12 variables. It can be downloaded directly from the City of Austin Open Data Portal.
As for the model, Prophet, as I mentioned, is a framework used at Facebook to handle time series problems. In other words, it is very strong for problems with data spanning long periods (months or years), with as much historical detail as possible, strong and well-defined seasonality, known holidays or special dates, and a non-linear growth trend that approaches a limit. The framework uses a decomposable time series model with three main components:
onde:
é a tendência, que modela as mudanças não-periódicas no valor da série temporal;
representa as mudanças periódicas (como sazonalidade semanal, anual, etc);
representa os efeitos dos feriados;
é o erro, as mudanças que não são capturadas pelo modelo.
This way, we can combine the two and analyze, among the animals that entered the organization, how many were adopted or returned to their owners. But first, let's look at the data dictionary:
- Animal ID - Animal identification number
- Name - Animal's name
- DateTime - Date and time of the animal's intake
- MonthYear - Month and year of the animal's intake
- Date of Birth - Animal's date of birth.
- Outcome Type - Outcome type
- Outcome Subtype - Outcome subtype
- Animal Type - Animal species
- Sex upon Outcome - Animal's sex
- Age Upon Outcome - Age at outcome.
- Breed - Animal's breed.
- Color - Animal's color
Here are the first five entries.
| Animal ID | Name | DateTime | MonthYear | Date of Birth | Outcome Type | Outcome Subtype | Animal Type | Sex upon Outcome | Age upon Outcome | Breed | Color | |
|---|---|---|---|---|---|---|---|---|---|---|---|---|
| 0 | A794011 | Chunk | 2019-05-08 18:20:00 | 05/08/2019 06:20:00 PM | 05/02/2017 | Rto-Adopt | NaN | Cat | Neutered Male | 2 years | Domestic Shorthair Mix | Brown Tabby/White |
| 1 | A776359 | Gizmo | 2018-07-18 16:02:00 | 07/18/2018 04:02:00 PM | 07/12/2017 | Adoption | NaN | Dog | Neutered Male | 1 year | Chihuahua Shorthair Mix | White/Brown |
| 2 | A720371 | Moose | 2016-02-13 17:59:00 | 02/13/2016 05:59:00 PM | 10/08/2015 | Adoption | NaN | Dog | Neutered Male | 4 months | Anatol Shepherd/Labrador Retriever | Buff |
| 3 | A674754 | NaN | 2014-03-18 11:47:00 | 03/18/2014 11:47:00 AM | 03/12/2014 | Transfer | Partner | Cat | Intact Male | 6 days | Domestic Shorthair Mix | Orange Tabby |
| 4 | A689724 | *Donatello | 2014-10-18 18:52:00 | 10/18/2014 06:52:00 PM | 08/01/2014 | Adoption | NaN | Cat | Neutered Male | 2 months | Domestic Shorthair Mix | Black |
We can see that each entry represents an animal that passed through the institution. For example, animal A794011, named Chunk, is a 2-year-old male cat that came in on May 8, 2019 and was adopted.
Besides getting to know the data, before even starting the Prophet implementation, I ran an exploratory analysis and found a large amount of missing data, as shown below:
Animal ID               0
Name                36817
DateTime                0
MonthYear               0
Date of Birth           0
Outcome Type            8
Outcome Subtype     64169
Animal Type             0
Sex upon Outcome        3
Age upon Outcome       47
Breed                   0
Color                   0
dtype: int64
I also counted the possible outcome types (Outcome Type).
Adoption           51722
Transfer           34892
Return to Owner    20636
Euthanasia          7890
Died                1075
Rto-Adopt            611
Disposal             495
Missing               67
Relocate              20
Name: Outcome Type, dtype: int64
This showed that, of the 117,416 records up to that date, 445 animals were adopted and, unfortunately, 6.7% were euthanized. Since adoption was the most common outcome, I ran the forecasts with the model for animals that were adopted or returned to their owners.
It's worth noting that these representations can be produced with any temporal aggregation, such as weekly or daily data. However, for clarity in this article I'll only show the weekly data; if you're interested in the complete work, the commented notebook includes those analyses.
What does the weekly temporal distribution of the data look like?
#gráfico semanaris
fig,ax=plt.subplots(figsize=   (10,5))adoptions_dd.resample('W').sum().plot(ax=ax)plt.show()
I could see that the data shows a fairly consistent temporal distribution. Even before fitting the model to separate the components of the time series, it is already possible to infer that this data has some trend and seasonality, with a small amount of noise.
First, I had to add the United States holiday dates.
#adicionando datas de feriados nacionais do Estado Unidos
modelo=Prophet()modelo2.add_country_holidays(country_name="US")modelo2.fit(prophet_dd)
Then I set the forecast period, using a value of 52, the number of weeks in a year.
#determinar o período
val_fut = modelo.make_future_dataframe(periods=52)
With all the parameters ready, I ran the forecasts.
# realizar a previsão para o período
forest = modelo.predict(val_fut)
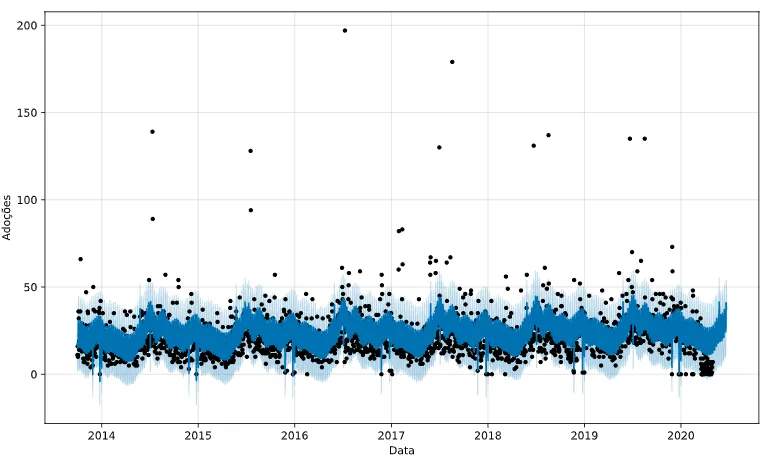
This way, we can see our forecast series for the weekly data by plotting it.
#Visualizando as previsões
modelo.plot(forest, xlabel="Data", ylabel = "Adoções")
Even though I already had a sense of the model's components, I separated them; they can be seen below, respectively: trend, holidays, weekends and vacations:
# separar os componentes do modelo
modelo.plot_components(forest2)
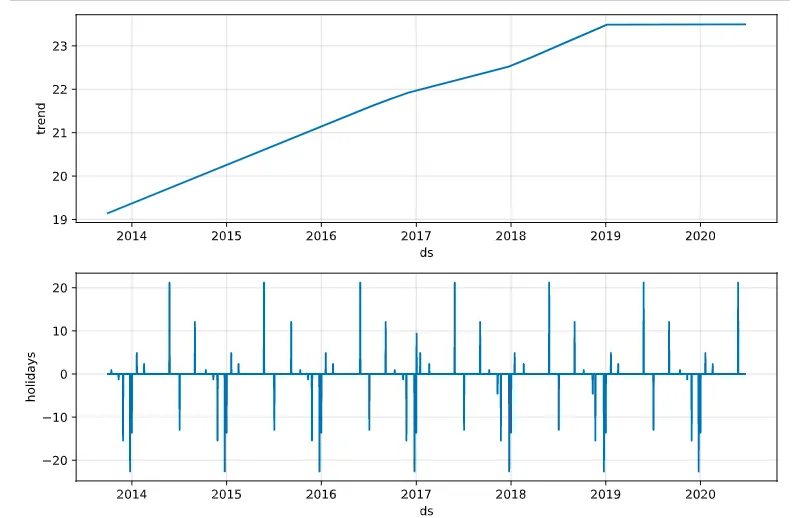
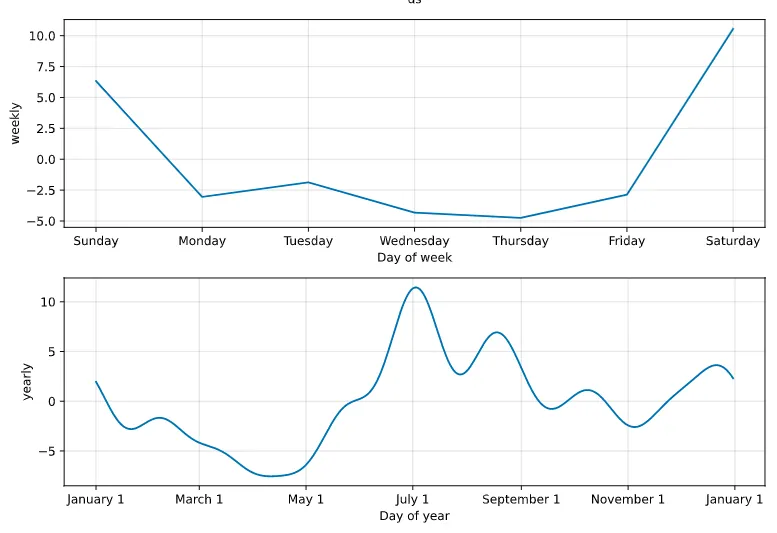
The components show a strong upward trend, which is expected to level off from the end of 2019 onward. I could also see the yearly distribution of holidays, weekends and vacations, which showed that more adoptions happen on holidays, with stronger seasonality on weekends and during summer vacation, which in that hemisphere falls in July.
To check whether my model worked well, I used cross-validation over 365 days as the performance metric. It uses the whole dataset as both test and training samples, partitioning and training at each iteration, as in the figure below:
This gives the following table, which shows the fit of the model to the data over time, for the first five periods.
from fbprophet.diagnostics import cross_validation
df_cross = cross_validation(modelo, horizon = '365 days')
df_cross.head()
| ds | yhat | yhat_lower | yhat_upper | y | cutoff | |
|---|---|---|---|---|---|---|
| 0 | 2016-10-31 | 15.595742 | 2.984438 | 27.270178 | 16 | 2016-10-30 12:00:00 |
| 1 | 2016-11-01 | 16.120902 | 4.142163 | 27.308199 | 16 | 2016-10-30 12:00:00 |
| 2 | 2016-11-02 | 14.068885 | 1.687266 | 24.864342 | 13 | 2016-10-30 12:00:00 |
| 3 | 2016-11-03 | 13.692068 | 1.367335 | 24.736610 | 21 | 2016-10-30 12:00:00 |
| 4 | 2016-11-04 | 14.611005 | 3.616050 | 28.060690 | 26 | 2016-10-30 12:00:00 |
I also needed to calculate the performance metrics, as shown below for the first five periods.
from fbprophet.diagnostics import performance_metrics
df_per = performance_metrics(df_cross)
df_per.head()
| horizon | mse | rmse | mae | mdape | coverage | |
|---|---|---|---|---|---|---|
| 0 | 36 days 12:00:00 | 96.537963 | 9.825373 | 7.186419 | 0.262747 | 0.858447 |
| 1 | 37 days 00:00:00 | 96.422144 | 9.819478 | 7.172768 | 0.262747 | 0.858447 |
| 2 | 37 days 12:00:00 | 97.372306 | 9.867741 | 7.265063 | 0.268853 | 0.858447 |
| 3 | 38 days 00:00:00 | 96.863575 | 9.841929 | 7.246640 | 0.269114 | 0.858447 |
| 4 | 38 days 12:00:00 | 96.506757 | 9.823785 | 7.218155 | 0.268853 | 0.863014 |
This showed that the model fit the data very well, as can be seen in the chart of the MDAPE (Median Absolute Percentage Error) metric below:
from fbprophet.plot import plot_cross_validation_metric
figura = plot_cross_validation_metric(df_cross,metric = 'mdape')
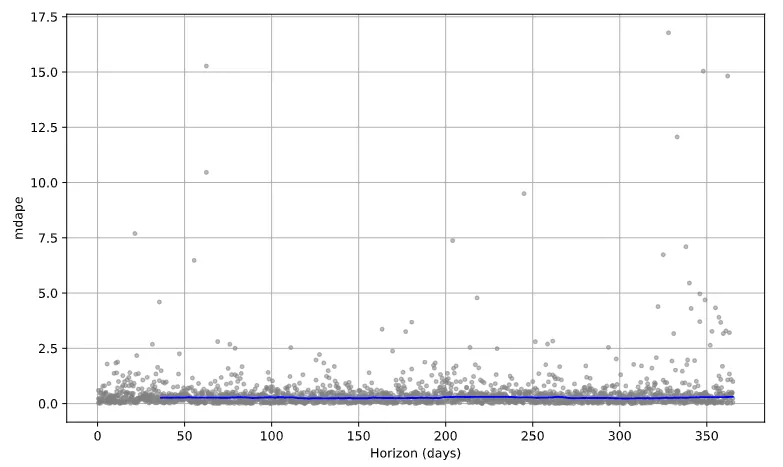
The chart above shows how well the model fits the data, indicating excellent performance. Even as an initial test, it effectively demonstrates that predictive models can be applied to any kind of dataset.
I should point out that this project is educational in nature, since it was a course exercise. Still, it clearly showed how effective predictive techniques can be when applied to any data, such as data from animal shelters. See the full project in the notebook.
Thanks for reading this far! If you'd like more information about this project, get in touch with me. Did you like the work? If so, share it with your friends. :)