Financial Analysis for Beef Cattle Farming

Translated from the original Portuguese article. Ler o original em português
It is no news that the country's agricultural industry is booming, but much of that is due to the many trend and production cycle analyses carried out by economists, analyses that help producers make decisions and keep growing over time. However, analyzing these production systems is not simple, especially because it is an open-air industry subject to many kinds of variables. This is particularly true of beef cattle farming, which has multi-year characteristics and responds more slowly to the market, as you will see in this article.
To do the analyses, I needed to obtain data on several commodities, and for that I used the investpy library, which provides an API with commands for a wide range of financial data. Before starting, I had to set a time window longer than 6 years, because of the beef cattle cycle; in this case I used 2004 to 2020. The price data for these products are the following:
Live Cattle - price of finished cattle (Boi Gordo)
Feeder Cattle - price of cattle being fattened (calves)
Dollar - Dollar/Real exchange rate
Other important data are the number of animals slaughtered by class (Bois, Vacas, Novilhos, Novilhas and Total, i.e., steers, cows, young steers, heifers and total) over the same time interval. These data were taken from SIDRA and used to validate the cycles and seasonality of production, as well as supply.
With all this data combined, we arrive at the following quarterly dataset for the chosen interval, as you can see in the first five entries of the table below:
| Live Cattle | Feeder Cattle | Dollar | Bois | Trimestre | Vacas | Novilhas | Novilhos | Total | |
|---|---|---|---|---|---|---|---|---|---|
| Date | |||||||||
| 2019-12-31 | 119.4500 | 145.150 | 4.108500 | 4768561.0 | 4º trimestre 2019 | 2086396.0 | 446799.0 | 779151.0 | 8080907.0 |
| 2020-03-31 | 120.1000 | 135.900 | 4.346767 | 3881075.0 | 1º trimestre 2020 | 2244800.0 | 324062.0 | 885949.0 | 7335886.0 |
| 2020-06-30 | 94.2875 | 126.315 | 5.334800 | 4126964.0 | 2º trimestre 2020 | 2061751.0 | 343375.0 | 870454.0 | 7402544.0 |
| 2020-09-30 | 104.2500 | 141.560 | 5.363700 | 4735421.0 | 3º trimestre 2020 | 1872475.0 | 390506.0 | 773276.0 | 7771678.0 |
| 2020-12-31 | 108.8750 | 138.380 | 5.390000 | 4707178.0 | 4º trimestre 2020 | 1580888.0 | 467577.0 | 607839.0 | 7363482.0 |
Some Feeder Cattle data for the years 2004 to 2007 are missing. Even though they do not affect the analyses much given the time scales I used, I replaced them with the median.
Production seasonality
Seasonality refers to events that tend to occur at a certain time of the year. Like any other production system, beef cattle farming is no different; however, it stands out because of its multi-year behavior, with its patterns changing over the course of a few years, usually 5 to 6.
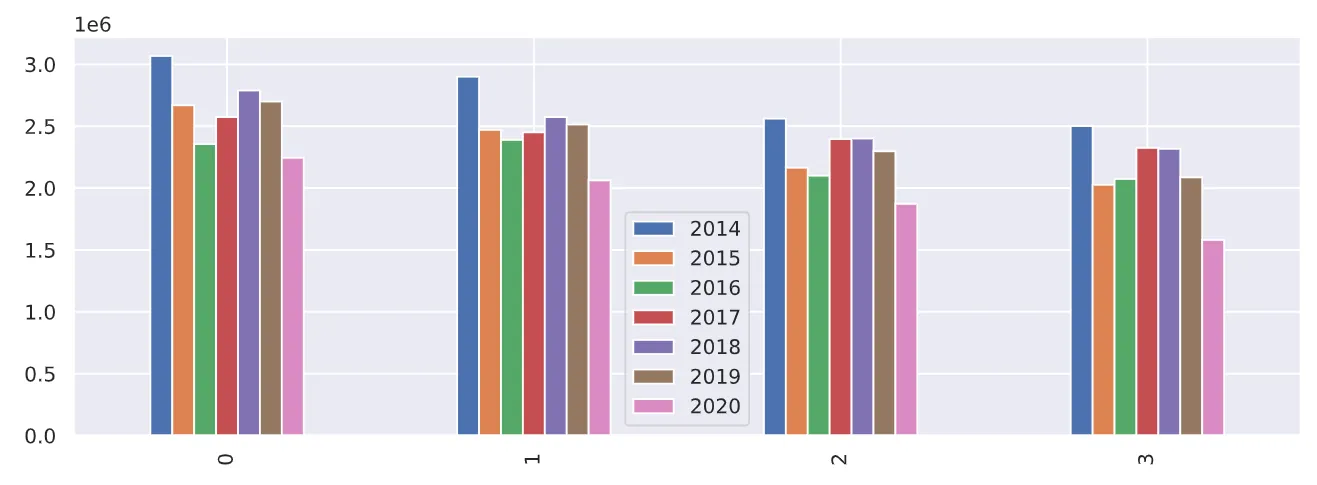
In the chart above, I grouped the number of female slaughters by year and quarter, which showed that the first quarter always has the highest number of female slaughters. This shows the importance of the supply of females during the slaughter period, because when supply is very high it tends to fill the slaughterhouses' schedules and push down the price per arroba (@) of male cattle.
But why is this stronger in the first quarter? It is due to the producer's sorting process: females that will not become pregnant again the following year are culled, so the larger culling of these animals happens in the first and second semesters. Another point is the drop that occurs in the third quarter, due to the off-season, when there are no pasture-finished steers and the supply of females is at its lowest.
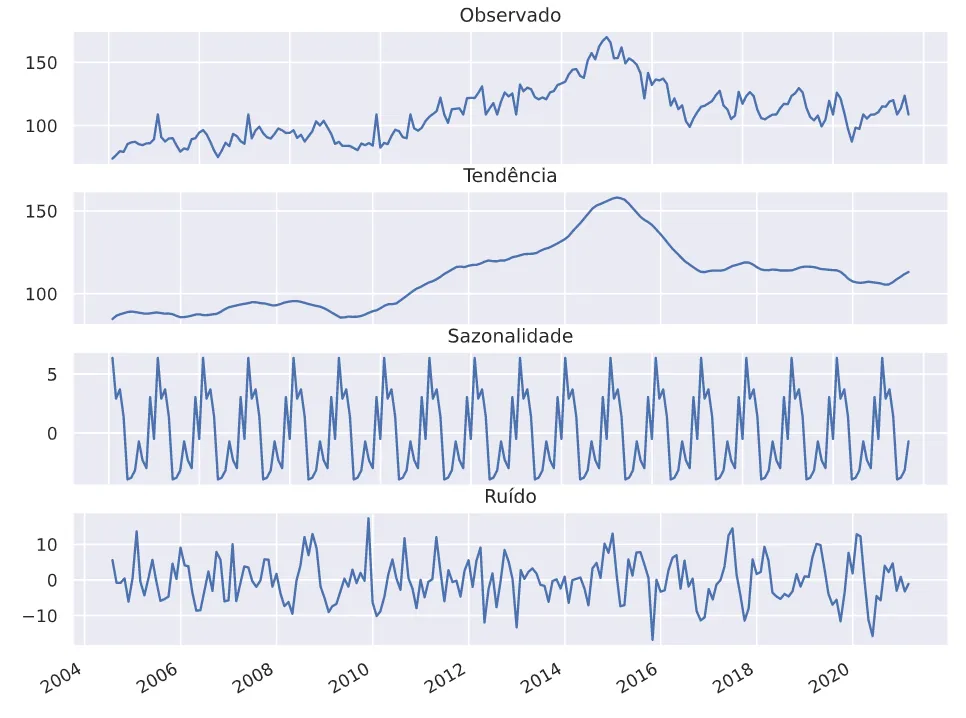
In the chart above, we can see the time series decomposition of the finished cattle (Boi Gordo) price from 2004 to 2019, showing the price trend and seasonality.
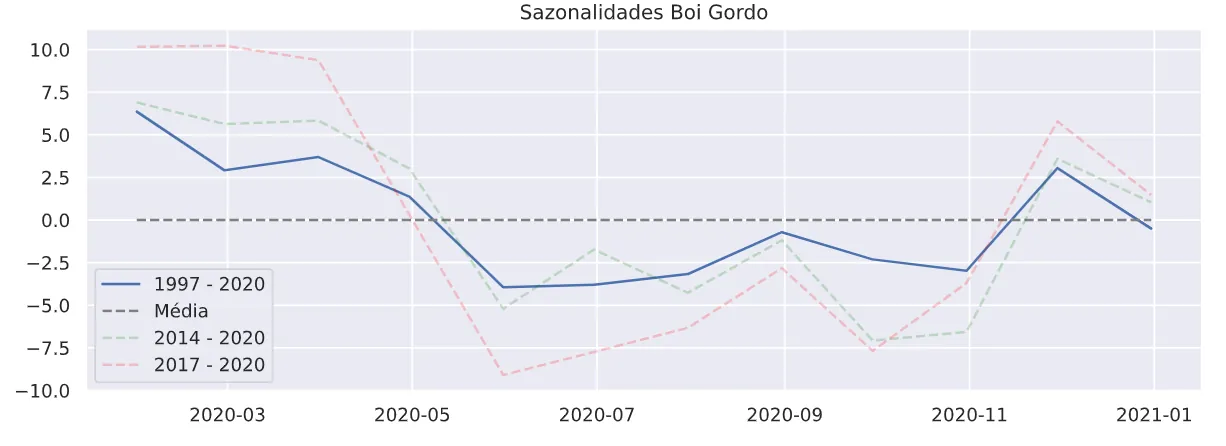
When I zoomed in on a 1-year interval, I could see that at the beginning of the year the price starts above the average, then drops sharply between May and June, rising again between November and December, where the pattern repeats.
Of course, since cattle farming is an open-air industry, as mentioned before, it is subject to weather events that can make prices vary, as well as abrupt changes in the financial market related to demand, such as a pandemic, for example.
I then analyzed the difference when using a shorter time interval to identify seasonality. Note that the low values are increasing, which is due to the greater number of animals raised in feedlots in recent years. This effect becomes even more pronounced when we shorten the analysis period further, and the trend is for the lowest prices to move to September and October.
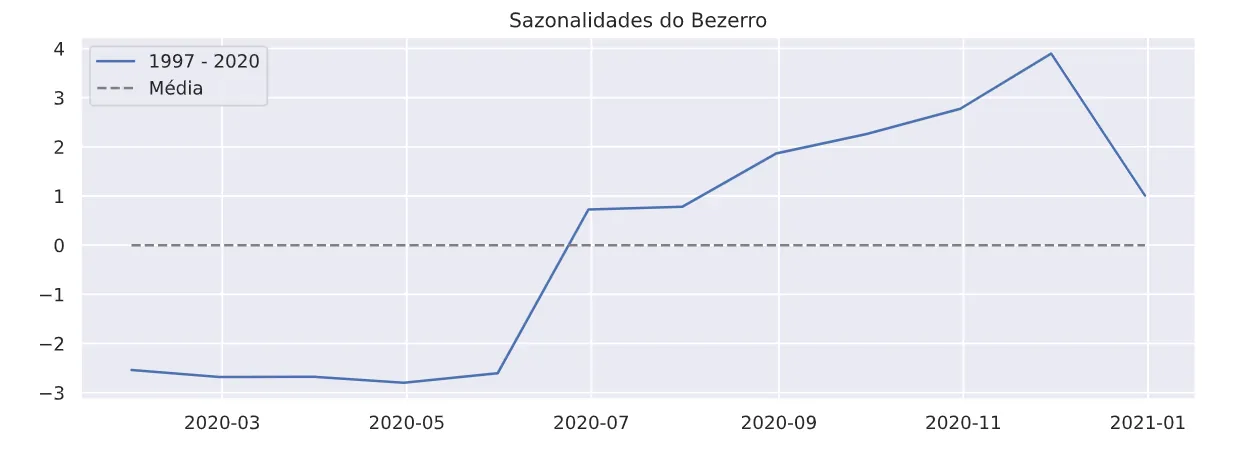
As for the calf price, the seasonality is quite different from the previous one: its price peaks around October and November, rising during the months when finished cattle prices are low. In addition, its longest low period is at the beginning of the year. This is due to the animal's weight: because of the breeding season at the end of the year, the calves are still thin.
Production cycle
Analyzing the share of females in the number of slaughters per quarter, I could see how strongly they influence the finished cattle price. Note that the red line and the gray line mark the maximum price; the projections show the idleness of slaughter, revealing a cycle that lasts 5 to 6 years and can vary over time.
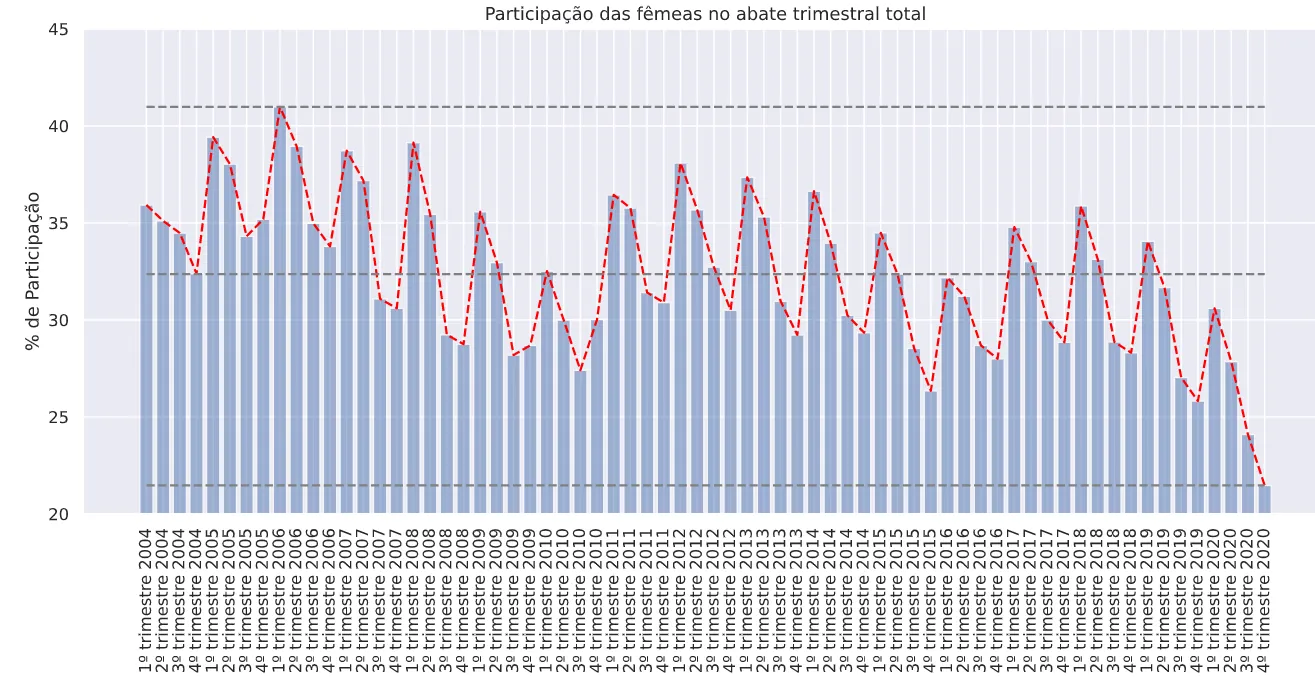
This interference becomes even clearer when we compare the calf price with the share of females. Note that as soon as the number of female slaughters increases, the calf price tends to drop. This is due to the rancher's decision-making: for example, when the calf price falls, ranchers tend to slaughter more females to fill the gaps in the market.
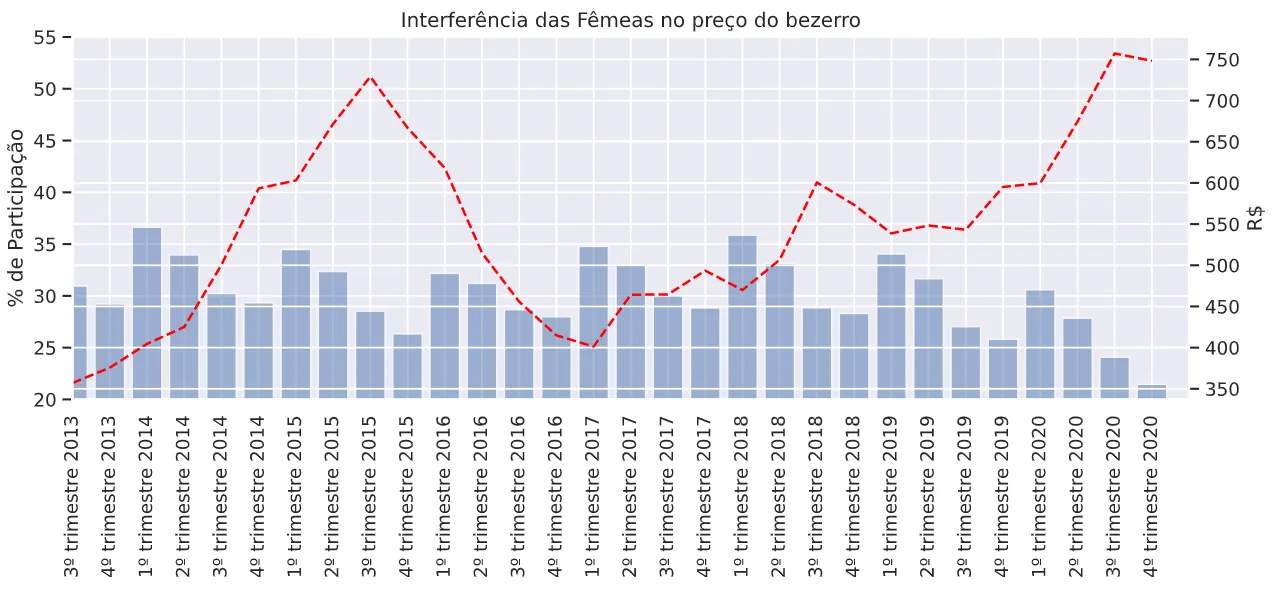
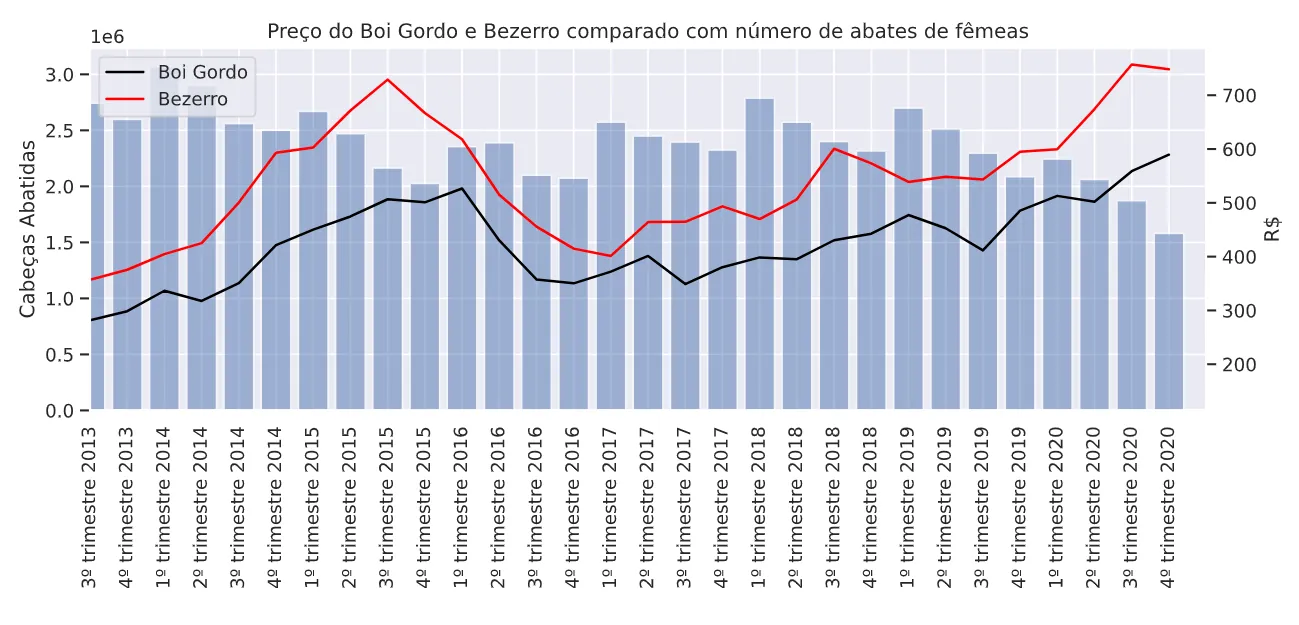
In the chart below, I compare the two price curves of finished cattle and calves. It shows that the two are similar, and also that the number of female slaughters drives the price of both finished cattle and calves: low prices coincide with higher numbers of female slaughters, the two being inversely proportional.
Much of this is due to the cattle growth cycle: gestation lasts 9 months, plus 7 more months until weaning, which reduces the supply of calves. Note that when calf and finished cattle prices rise, producers keep more of their females, producing more calves, which in turn causes prices to fall again and later leads to more female slaughters, which will reduce the number of calves, starting the cycle again.
Production trend
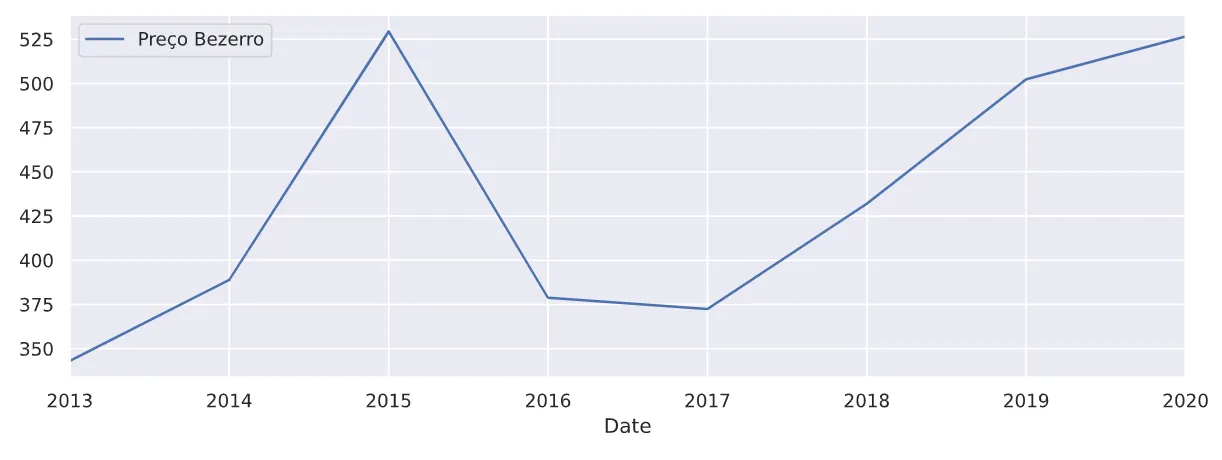
Looking at the calf price trend, we can see that it has been in a phase of rising prices since 2017.
However, the annual trend of the finished cattle price is downward.
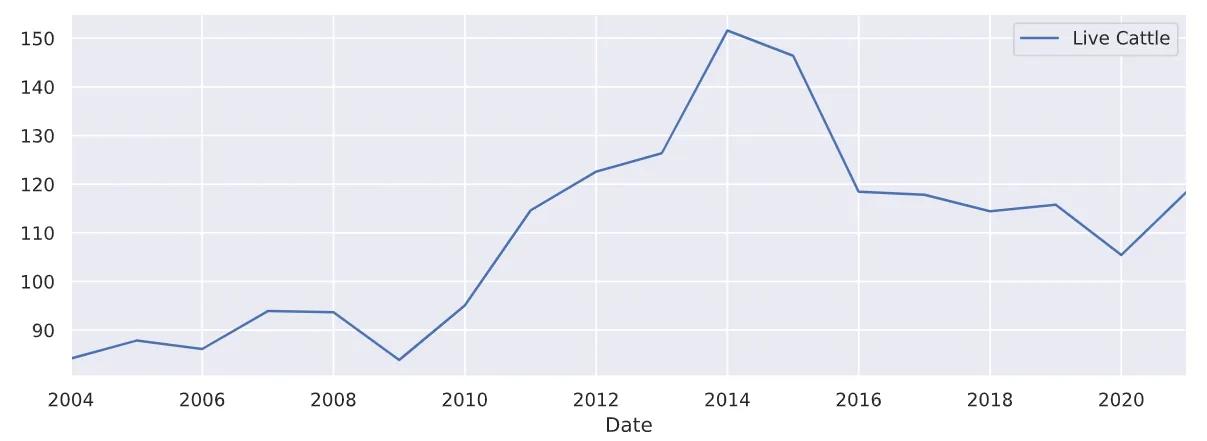
Of course, there is some interference due to the missing data and the preprocessing done to replace them with the median, but based on the analyses carried out here, it is possible to conclude that the trend for 2021 is for the calf price to rise, as well as the finished cattle price.
Nevertheless, from a monthly point of view, there is a tendency for their price lows to shift to September. Another notable point is that the number of female slaughters is trending downward, which may be a warning sign for prices, given the possibility that they may fall again.
All the code used here for the analysis and for querying the databases is available in my GitHub repository; if you want to check it out, click here.